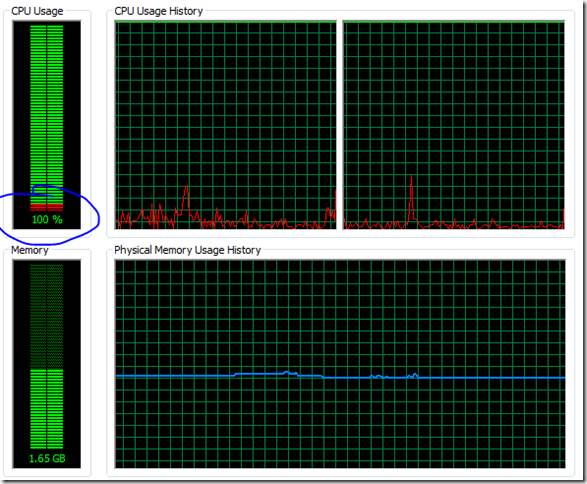
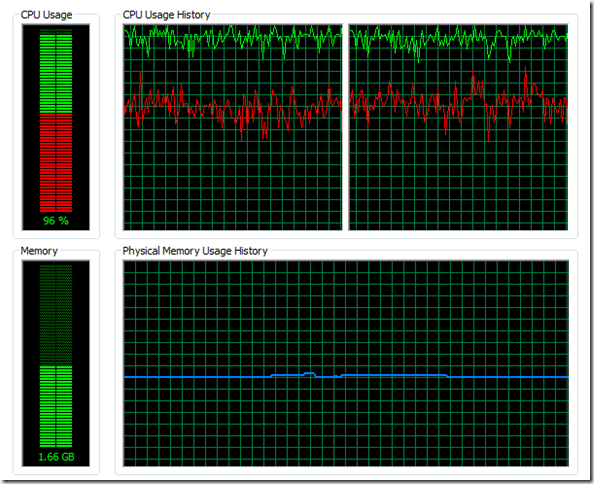
When I open windows task manager it says that CPU usage is at 100%. Even I have enough Memory, CPU cores. What happened under the hood? Before you dig more, remember to Show the Kernel time vs User time. [Click View->Show kernel times], then you will see some spikes in red. The Percentage of the red really means a lot. Here is two snapshoot. It’s a live snapshoot I captured. You may see the source code at the end of the blog.
CPU 100%, Kernel time is less than 5% percent.
Same 100% CPU, Kernel time is over 60%.
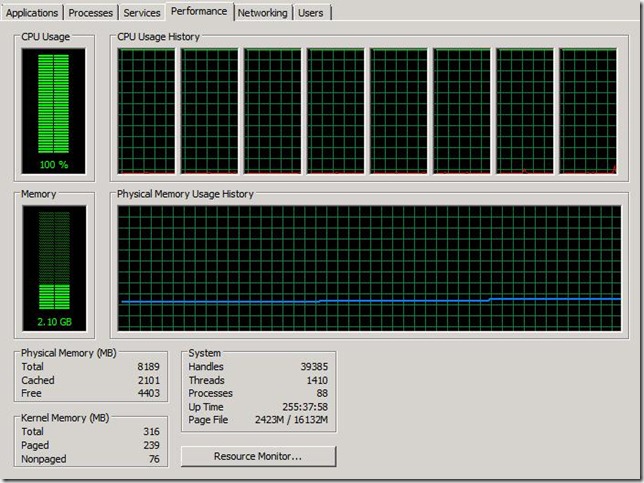
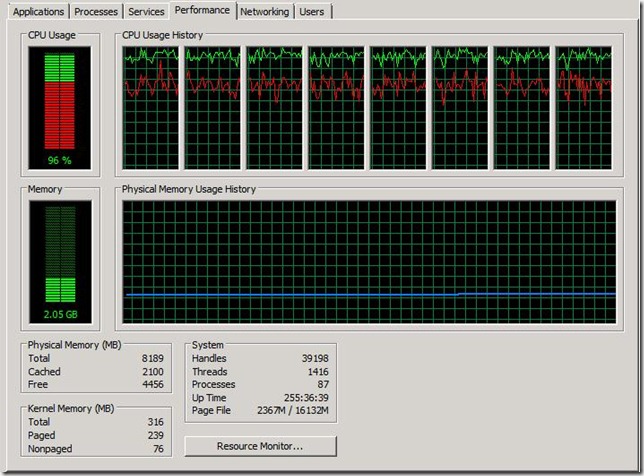
even I change the app to run a more powerful machine. with 8 Cores, Xeron CPU.
in this specific case, CPU is extremely busy, Memory looks good (no spike, and still at lot free RAM available.), What are those resources drained a lot CPU? for those kernel things, they might be the following types
- DISK I/O, Check the VMstat or disk queue length in windows, Driver issue?
- Network I/O. (DB connection, lot round-trip call?)
- Thread context switching. ( Locks, contention. quantum management.), you can check the cs in vmstat , In windows, using the performance counter System->Context Switches/sec
- System\Context Switches/sec, which measures how frequently the processor has to switch from user- to kernel-mode to handle a request from a thread running in user mode. The heavier the workload running on your machine, the higher this counter will generally be, but over long term the value of this counter should remain fairly constant. If this counter suddenly starts increasing however, it may be an indicating of a malfunctioning device, especially if you are seeing a similar jump in the Processor(_Total)\Interrupts/sec counter on your machine.
if you want to reproduce the above CPU usage. here is the C# source code.
Comment or uncomment the link of ReadFile("c:\\windows"); will make a big difference. in this code, the read time is spent by Disk I/O.
| namespace ConsoleApplication4 } for (int i = 0; i < count; i++) } Console.ReadLine(); static void Func(object o) } private static void ReadFile(string Dir) foreach (String f in System.IO.Directory.GetFiles(Dir)) } |
reference
Key Performance Monitor Counters http://www.windowsnetworking.com/articles_tutorials/Key-Performance-Monitor-Counters.html
vmstat command : http://publib.boulder.ibm.com/infocenter/aix/v6r1/index.jsp?topic=/com.ibm.aix.prftungd/doc/prftungd/vmstat_command.htm


No comments:
Post a Comment