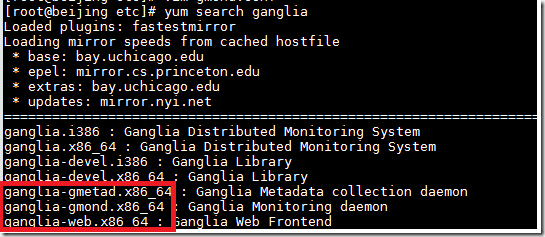
Ganglia has three pieces, Gmond/Gmetad/Gweb, as you search ganglia using yum, you may see those 3 components.

Gmond is the monitoring Agent, collecting data and persist it (need to be deployed to every server that we monitor.)
So yum install ganglia-gmond.
in the /etc/gmond.conf, you can see the cluster name, change it to your cluster name, I will pickup the sameone like hadoop cluster.
also it has some configuration about the multi-cast ( basically, monitoring agent using multi-cast to make the data replicated on each node. so every node could ansewer all the query request for each server in the same cluseter.) like the typically share-nothing cluster. each node also listens one tcp port.
that’s it. after that we can start the gmond daemon.
run gmond –t (show the current configuration.)
Gmetad daemon aggregates monitroing data from the clusters. and persit the data using the rrdtool.
so you may need 1+ nodes to do the HA. yum install ganglia-gmetad
for the gmetad configuration, just add the data_source, point to one of the Gmond node
then the config like wheter to store the rrdtool. by default it’s under /var/lib/ganglia/rrds
then gmetad will begin collect data. you can check the folder to see wheter data got collected.
the last one is the gweb, as the name implies, it’s a web interface for the end user to see the charts. basically it’s a standard PHP application using the php-gd module to generate some dynamic charts.
yum install ganglia-gweb will download all the php files. and it’s under /usr/share/ganglia by default.
chose you fav. application, I will use the httpd, and just copy the files to the html root ,for me will be /var/www/html
you need fix the conf.php mappting to /etc/ganglia/conf.php

you need tell the web where is the data located ( the data gmetad aggreateed) then that’s it.
then you can see http://webserver/ganglia to see the charts.
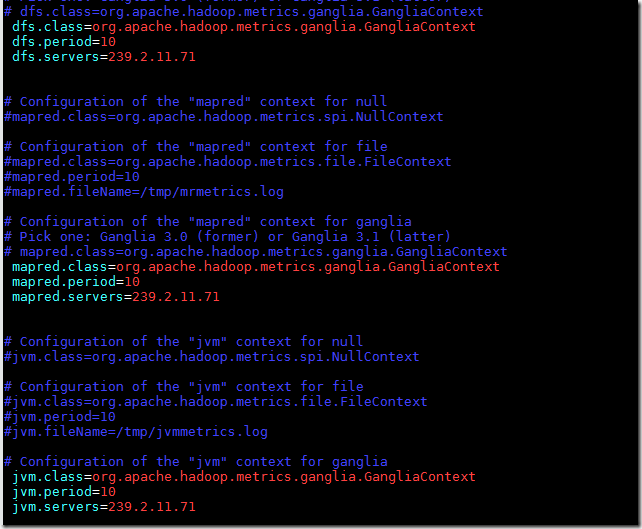
for the hadoop/hbase, just change the hadoop-metrics.properties under the hadoop conf folder.
point the class to gangliacontext and remember to setup the server to the muliticast ip instead of localhost , anotherwise, no data will be collected if you use the default gmond mulit-cast mode

then you can see it in the ganglia console, like the metrics of the hadoop


