Wednesday, July 28, 2010

Oracle Coherence 3.6. ad-hoc query without using the filter, aggregator, entryproessor. using SQL like syntax called CohQL

one of the enhancement of Coherence 3.6 is the Coherence Query language, they call CohQL. Shall I spell CQL along with LinQ, SQL?
 

Before this version. you have to hardcode different filters to enable filtering which corresponds to Where clause in SQL.  It will be more intuitive to write a query just like the SQL.  Now it is possible in 3.6

SELECT (properties* aggregators* | * | alias) FROM "cache-name" [[AS] alias] [WHERE conditional-expression] [GROUP [BY] properties+]

Given a POJO Class PurchaseOrder with three attributes PoAmount, State, PMName.
   if you want to query those POs in a given state and With a least amount. you need Three Filters. might Be

Filter gt=new GreaterFilter("getPoAmount", 7.0f);
Filter et=new EqualsFilter("getState" , "CA");
Filter caandgreate7 =new AndFilter(gt,et);
System.out.println(pCache.entrySet(caandgreate7).size());

In 3.6, you can just put a query like the where clause syntax directly. the following code will do the same query

Filter AdHoc=com.tangosol.util.QueryHelper.createFilter("PoAmount >7.0f AND State='CA'");
System.out.println(pCache.entrySet(AdHoc).size());

If you use Coherence to store a lot data for Analytics, another good news is that it comes up with a new utility like the SQL client for DB.  
  before, you want to run a group by State and get the average poAmount.

EntryAggregator gp=GroupAggregator.createInstance("getState", new DoubleAverage("getPoAmount"));
Object o=pCache.aggregate((Filter)null, gp);
System.out.println(o);

you will get some result like

{CA=46.42647790186333, OR=51.46033203601837, WA=46.86704759886771}

Now with the new query client. you just run a sql like group
image 
Is it sweet? I think So.

even some management features like Backup DB
image


More query Syntax and support, check http://download.oracle.com/docs/cd/E15357_01/coh.360/e15723/api_cq.htm#CEGDBJBI

Monday, July 26, 2010

How to create a Cassandra cluster on a single PC / windows Tutorial

I have been playing with Cassandra couple days recently, I will summarize the prerequisites to run a cluster in a single PC. here it comes a tutorial to run/create a Cassandra cluster on windows.

before you try to run/create a cluster, please check the following requirements.

  • Install a JDK/JRE
    • 32/64 bit jvm
  • Pickup three/four TCP Ports
    • Cassandra storage
      • default is 7000
    • Thrift Listener
      • for the remote client connection
      • default is 9160
    • JMX monitoring port for two nodes, one is 8080, another one is 9080
    • JWDP debugging port (optional)
  • At least two IP address you can use. each member need one dedicated IP address.

in this given example, I will setup one cluster named HelloCassendra with two storage nodes.

  • Download the Cassandra bits from http://cassandra.apache.org/ , . I downloaded 0.6.3.
    • unzip it to a folder like C:\apache-cassandra-0.6.3
  • Copy two Conf folders, and rename that at conf1, conf2. We are going to use  one codebase, but create two separate configurations.
    • C:\apache-cassandra-0.6.3\conf1
    • C:\apache-cassandra-0.6.3\conf2
  • go to conf1 folder, change two cong files. Conf1 will listen on 127.0.0.1 and acts as the seed node. (Cassandra use the gossip-based clustering protocol. we will config this node as the seed node.)
    • C:\apache-cassandra-0.6.3\conf1\log4j.properties
      • # Edit the next line to point to your logs directory
        log4j.appender.R.File=/var/log/cassandra/system.log
      • change the folder to =/var/log/cassandra/c1/system.log
      • so this node will put the log to c:/var/log/cassandra/c1/system.log
    • C:\apache-cassandra-0.6.3\conf1\storage-conf.xml
      • Change the clustername to HelloCassandra
        • <ClusterName>Test Cluster</ClusterName>
        • <ClusterName>HelloCassandra</ClusterName>
      • change the commitlogdirectory and DataFileDirectory
        • <CommitLogDirectory>/var/lib/cassandra/C1/commitlog</CommitLogDirectory>
            <DataFileDirectories>
                <DataFileDirectory>/var/lib/cassandra/C1/data</DataFileDirectory>
            </DataFileDirectories>
      • replacethe localhost with 127.0.0.1 explicitly.
        • <ListenAddress>127.0.0.1</ListenAddress>
        • <ThriftAddress>127.0.0.1</ThriftAddress>
  • go to conf2 folder, change two cong files. Conf2 will listen on 127.0.0.2 and acts as the regular node. will talk to seed node 127.0.0.1 for membership information)
    • C:\apache-cassandra-0.6.3\conf2\log4j.properties
      • # Edit the next line to point to your logs directory
        log4j.appender.R.File=/var/log/cassandra/system.log
      • change the folder to =/var/log/cassandra/c2/system.log
      • so this node will put the log to c:/var/log/cassandra/c2/system.log
    • C:\apache-cassandra-0.6.3\conf2\storage-conf.xml
      • Change the clustername to HelloCassandra
        • <ClusterName>Test Cluster</ClusterName>
        • <ClusterName>HelloCassandra</ClusterName>
      • change the commitlogdirectory and DataFileDirectory
        • <CommitLogDirectory>/var/lib/cassandra/C2/commitlog</CommitLogDirectory>
            <DataFileDirectories>
                <DataFileDirectory>/var/lib/cassandra/C3/data</DataFileDirectory>
            </DataFileDirectories>
      • replace the localhost with 127.0.0.2 explicitly.
        • <ListenAddress>127.0.0.2</ListenAddress>
        • <ThriftAddress>127.0.0.2</ThriftAddress>
      • enable the auto bootstrap mode
        • <AutoBootstrap>false</AutoBootstrap>
  • Go to C:\apache-cassandra-0.6.3\bin, copy cassandra.bat as c1.bat and c2.bat. each bat will be the bootstrap of different instance.
    • C:\apache-cassandra-0.6.3\bin\c1.bat
    • C:\apache-cassandra-0.6.3\bin\c2.bat
  • EDIT c1.bat, point to the conf1 folder, and change the default JMX PORT and Debug Port
    • if NOT DEFINED CASSANDRA_CONF set CASSANDRA_CONF=%CASSANDRA_HOME%\conf
      • if NOT DEFINED CASSANDRA_CONF set CASSANDRA_CONF=%CASSANDRA_HOME%\conf1
    • disable the debugging by remove the follow line
      • -Xrunjdwp:transport=dt_socket,server=y,address=8888,suspend=n^
    • for the C1 instance, keep the default jmx port 8080
      • -Dcom.sun.management.jmxremote.port=8080^
  • EDIT c2.bat, point to the conf2 folder, and change the default JMX PORT and Debug Port
    • if NOT DEFINED CASSANDRA_CONF set CASSANDRA_CONF=%CASSANDRA_HOME%\conf
      • if NOT DEFINED CASSANDRA_CONF set CASSANDRA_CONF=%CASSANDRA_HOME%\conf2
    • disable the debugging by remove the follow line
      • -Xrunjdwp:transport=dt_socket,server=y,address=8888,suspend=n^
    • for the C2 instance, change the default jmx port 8080 to 9080
      • -Dcom.sun.management.jmxremote.port=9080^
  • Click to start c1.bat and c2.bat

When you start C1.bat. you might get the following information. it will tell you that this node is confgured to be a seed node. its thrift port.

Starting Cassandra Server
INFO 16:04:31,597 Auto DiskAccessMode determined to be mmap
INFO 16:04:31,909 Saved Token not found. Using 22656600690150525193669162742751150004
INFO 16:04:31,909 Saved ClusterName not found. Using HelloCassandra
INFO 16:04:31,909 Creating new commitlog segment /var/lib/cassandra/c1/commitlog\CommitLog-1280185471909.log
INFO 16:04:31,987 LocationInfo has reached its threshold; switching in a fresh Memtable at CommitLogContext(file='/var/lib/cassandra/c1/commitlog\C
INFO 16:04:31,987 Enqueuing flush of Memtable-LocationInfo@1351579886(171 bytes, 4 operations)
INFO 16:04:31,987 Writing Memtable-LocationInfo@1351579886(171 bytes, 4 operations)
INFO 16:04:32,236 Completed flushing C:\var\lib\cassandra\c1\data\system\LocationInfo-1-Data.db
INFO 16:04:32,283 Starting up server gossip
INFO 16:04:32,299 This node will not auto bootstrap because it is configured to be a seed node.
INFO 16:04:32,346 Binding thrift service to /127.0.0.1:9160
INFO 16:04:32,346 Cassandra starting up...


then you may run a tcpview to check how many ports instance 1 is listening.
image

here, 7000 is the storage port, 8080 is the jmx port, so you may use jconsole to connect and monitor this jvm. 9160 is the thrift port. How about 60625 and 60626?
   
   now, there is only one node in the cluster.

C:\apache-cassandra-0.6.3>bin\nodetool --host 127.0.0.1 --port 8080 ring
Starting NodeTool
Address       Status     Load          Range                                      Ring
127.0.0.1     Up         497 bytes     22656600690150525193669162742751150004     |<--|

time to kick off the c2.bat, after that, you will notice that C2 joins the cluster. and wait for some time to do some housekeeping thing, might take 120 seconds.
 

Starting Cassandra Server
INFO 16:11:58,940 Auto DiskAccessMode determined to be mmap
INFO 16:11:59,237 Saved Token not found. Using 168810650452358861593947197964955051846
INFO 16:11:59,252 Saved ClusterName not found. Using HelloCassandra
INFO 16:11:59,252 Creating new commitlog segment /var/lib/cassandra/c2/commitlog\CommitLog-1280185919252.log
INFO 16:11:59,315 LocationInfo has reached its threshold; switching in a fresh Memtable at CommitLogContext(file='/var/lib/cassandra/c2/commitlog\Com
INFO 16:11:59,315 Enqueuing flush of Memtable-LocationInfo@625647261(171 bytes, 4 operations)
INFO 16:11:59,315 Writing Memtable-LocationInfo@625647261(171 bytes, 4 operations)
INFO 16:11:59,564 Completed flushing C:\var\lib\cassandra\c2\data\system\LocationInfo-1-Data.db
INFO 16:11:59,596 Starting up server gossip
INFO 16:11:59,627 Joining: getting load information
INFO 16:11:59,627 Sleeping 90000 ms to wait for load information...
INFO 16:12:01,577 Node /127.0.0.1 is now part of the cluster
INFO 16:12:02,592 InetAddress /127.0.0.1 is now UP
INFO 16:12:02,592 Started hinted handoff for endPoint /127.0.0.1
INFO 16:12:02,607 Finished hinted handoff of 0 rows to endpoint /127.0.0.1
INFO 16:13:29,657 Joining: getting bootstrap token
INFO 16:16:44,916 New token will be 107727192420385141059512814600693202868 to assume load from /127.0.0.1
INFO 16:16:44,931 Joining: sleeping 30000 ms for pending range setup
INFO 16:17:14,952 Bootstrapping
INFO 16:17:15,030 Bootstrap/move completed! Now serving reads.
INFO 16:17:15,108 Binding thrift service to /127.0.0.2:9160
INFO 16:17:15,108 Cassandra starting up...

run tcpview again, you will see two nodes are get established via the storage port.
image
   run the ring query again.

C:\apache-cassandra-0.6.3>bin\nodetool --host 127.0.0.1 --port 8080 ring
Starting NodeTool
Address       Status     Load          Range                                      Ring
                                       107727192420385141059512814600693202868
127.0.0.1     Up         497 bytes     22656600690150525193669162742751150004     |<--|
127.0.0.2     Up         497 bytes     107727192420385141059512814600693202868    |-->|


Also you can use the Jconsole to monitor the Nodes.  
  run jconsole which is located in the java sdk bin directly. connect to the node 1 by localhost:8080, node 2 by localhost:9080.
  unfold those mbeans, you will be able to see a lot counters.

image


Now, everything is set. enjoy you exploring.

More open source solutions.

Friday, July 23, 2010

how to setup multi ip address on one network card for Linux /MAC MACBOOK

When you test the Cassandra clustering on a Single laptop. It requires several IP addresses to build one cluster. here is the how to setup one Linux and matchbook.

  • Linux.
      setup 127.0.0.5 and 127.0.0.100 to Loopback interface


      androiddemo:/home/demouser# ifconfig lo:5 127.0.0.5 netmask 255.0.0.0 up
      androiddemo:/home/demouser# ping 127.0.0.5
      PING 127.0.0.5 (127.0.0.5) 56(84) bytes of data.
      64 bytes from 127.0.0.5: icmp_seq=1 ttl=64 time=0.040 ms
      64 bytes from 127.0.0.5: icmp_seq=2 ttl=64 time=0.025 ms
      ^C
      --- 127.0.0.5 ping statistics ---
      2 packets transmitted, 2 received, 0% packet loss, time 999ms
      rtt min/avg/max/mdev = 0.025/0.032/0.040/0.009 ms
      androiddemo:/home/demouser# ifconfig lo:100 127.0.0.100 netmask 255.0.0.0 up
      androiddemo:/home/demouser# ping 127.0.0.100
      PING 127.0.0.100 (127.0.0.100) 56(84) bytes of data.
      64 bytes from 127.0.0.100: icmp_seq=1 ttl=64 time=0.031 ms
      ^C

  • Macbook
      setup 127.0.0.2 and 127.0.0.3 to loopback interface

      DemoMacbook-MacBook:~ androidyou$ sudo ifconfig lo0
      lo0: flags=8049<UP,LOOPBACK,RUNNING,MULTICAST> mtu 16384
          inet 127.0.0.1 netmask 0xff000000
          inet6 ::1 prefixlen 128
          inet6 fe80::1%lo0 prefixlen 64 scopeid 0x1
      DemoMacbook-MacBook:~ androidyou$ sudo ifconfig lo0 alias 127.0.0.2
      DemoMacbook-MacBook:~ androidyou$ sudo ifconfig lo0 alias 127.0.0.3
      DemoMacbook-MacBook:~ androidyou$ sudo ifconfig lo0
      lo0: flags=8049<UP,LOOPBACK,RUNNING,MULTICAST> mtu 16384
          inet 127.0.0.1 netmask 0xff000000
          inet6 ::1 prefixlen 128
          inet6 fe80::1%lo0 prefixlen 64 scopeid 0x1
          inet 127.0.0.2 netmask 0xff000000
          inet 127.0.0.3 netmask 0xff000000
      DemoMacbook-MacBook:~ androidyou$ ping 127.0.0.3
      PING 127.0.0.3 (127.0.0.3): 56 data bytes
      64 bytes from 127.0.0.3: icmp_seq=0 ttl=64 time=0.040 ms
      64 bytes from 127.0.0.3: icmp_seq=1 ttl=64 time=0.047 ms


Hope it helps

Wednesday, July 21, 2010

G1 bootloader loop, zygote memory access error. signal 11 (SIGSEGV), fault addr

My friend got a G1 and he really love it. he hacked it and load it up with the 2.1. One day, the phone just crashed. and the lovely T-mobile logo appears on the bootup screen and never disappear. then he comes to me for any hints about the crash.

the first thing, I want to check the stacktace, or the logcat.
   then I run “Adb Shell Logcat “ , Get some interesting Loops. basically, the runtime cant start zygote which is the system library process owner.
   the stack looks like this.

I/Zygote  (  764): Preloading classes...
D/dalvikvm(  764): GC freed 793 objects / 50568 bytes in 5ms
D/dalvikvm(  764): GC freed 251 objects / 16168 bytes in 6ms
D/dalvikvm(  764): GC freed 295 objects / 18768 bytes in 7ms
D/dalvikvm(  764): GC freed 214 objects / 13712 bytes in 8ms
D/dalvikvm(  764): GC freed 415 objects / 26552 bytes in 9ms
D/skia    (  764): ------ build_power_table 1.4
D/skia    (  764): ------ build_power_table 0.714286
D/dalvikvm(  764): GC freed 416 objects / 28336 bytes in 10ms
D/dalvikvm(  764): Trying to load lib /system/lib/libmedia_jni.so 0x0
D/dalvikvm(  764): Added shared lib /system/lib/libmedia_jni.so 0x0
D/dalvikvm(  764): Trying to load lib /system/lib/libexif.so 0x0
D/dalvikvm(  764): Added shared lib /system/lib/libexif.so 0x0
D/dalvikvm(  764): GC freed 2303 objects / 121184 bytes in 13ms
D/dalvikvm(  764): Trying to load lib /system/lib/libmedia_jni.so 0x0
D/dalvikvm(  764): Shared lib '/system/lib/libmedia_jni.so' already loaded in same CL 0x0
D/dalvikvm(  764): Trying to load lib /system/lib/libmedia_jni.so 0x0
D/dalvikvm(  764): Shared lib '/system/lib/libmedia_jni.so' already loaded in same CL 0x0
D/dalvikvm(  764): Trying to load lib /system/lib/libmedia_jni.so 0x0
D/dalvikvm(  764): Shared lib '/system/lib/libmedia_jni.so' already loaded in same CL 0x0
D/dalvikvm(  764): Trying to load lib /system/lib/libmedia_jni.so 0x0
D/dalvikvm(  764): Shared lib '/system/lib/libmedia_jni.so' already loaded in same CL 0x0
D/dalvikvm(  764): GC freed 3790 objects / 197016 bytes in 23ms
D/dalvikvm(  764): GC freed 459 objects / 26008 bytes in 21ms
D/dalvikvm(  764): GC freed 303 objects / 17560 bytes in 22ms
D/dalvikvm(  764): GC freed 204 objects / 11448 bytes in 25ms
D/dalvikvm(  764): GC freed 161 objects / 8728 bytes in 26ms
D/dalvikvm(  764): Trying to load lib /system/lib/libsrec_jni.so 0x0
D/dalvikvm(  764): Added shared lib /system/lib/libsrec_jni.so 0x0
D/dalvikvm(  764): Trying to load lib /system/lib/libsrec_jni.so 0x0
D/dalvikvm(  764): Shared lib '/system/lib/libsrec_jni.so' already loaded in same CL 0x0
D/dalvikvm(  764): GC freed 365 objects / 71664 bytes in 28ms
D/dalvikvm(  764): GC freed 790 objects / 48088 bytes in 39ms
D/dalvikvm(  764): GC freed 331 objects / 38184 bytes in 40ms
D/dalvikvm(  764): GC freed 418 objects / 25784 bytes in 41ms
D/dalvikvm(  764): Trying to load lib /system/lib/libwebcore.so 0x0
D/dalvikvm(  764): Added shared lib /system/lib/libwebcore.so 0x0
D/dalvikvm(  764): GC freed 432 objects / 25168 bytes in 42ms
I/DEBUG   (  189): *** *** *** *** *** *** *** *** *** *** *** *** *** *** *** ***
I/DEBUG   (  189): Build fingerprint: 'google/passion/passion/mahimahi:2.1-update1/ERE27/24178:user/release-ke
I/DEBUG   (  189): pid: 764, tid: 764  >>> zygote <<<
I/DEBUG   (  189): signal 11 (SIGSEGV), fault addr ef2d002b
I/DEBUG   (  189):  r0 f0b00720  r1 00000002  r2 0000e16c  r3 00000000
I/DEBUG   (  189):  r4 ef2d0023  r5 00000005  r6 00000000  r7 4104ee7c
I/DEBUG   (  189):  r8 ad00f3c0  r9 0000bcf0  10 4104edc0  fp 00000000
I/DEBUG   (  189):  ip ad0800d4  sp be8b47b0  lr ad0277fb  pc ad034514  cpsr a0000030
I/DEBUG   (  189):          #00  pc 00034514  /system/lib/libdvm.so
I/DEBUG   (  189):          #01  pc 00054664  /system/lib/libdvm.so
I/DEBUG   (  189):          #02  pc 00013f98  /system/lib/libdvm.so
I/DEBUG   (  189):          #03  pc 000198e4  /system/lib/libdvm.so
I/DEBUG   (  189):          #04  pc 00018da8  /system/lib/libdvm.so
I/DEBUG   (  189):          #05  pc 0004d850  /system/lib/libdvm.so
I/DEBUG   (  189):          #06  pc 0004d882  /system/lib/libdvm.so
I/DEBUG   (  189):          #07  pc 00034e1c  /system/lib/libdvm.so
I/DEBUG   (  189):          #08  pc 00034bca  /system/lib/libdvm.so
I/DEBUG   (  189):          #09  pc 00034c9c  /system/lib/libdvm.so
I/DEBUG   (  189):          #10  pc 00037270  /system/lib/libdvm.so
I/DEBUG   (  189):          #11  pc 00014120  /system/lib/libdvm.so
I/DEBUG   (  189):          #12  pc 000198e4  /system/lib/libdvm.so
I/DEBUG   (  189):          #13  pc 00018da8  /system/lib/libdvm.so
I/DEBUG   (  189):          #14  pc 0004d850  /system/lib/libdvm.so
I/DEBUG   (  189):          #15  pc 0004d882  /system/lib/libdvm.so
I/DEBUG   (  189):          #16  pc 000583b6  /system/lib/libdvm.so
I/DEBUG   (  189):          #17  pc 00058d9e  /system/lib/libdvm.so
I/DEBUG   (  189):          #18  pc 00052204  /system/lib/libdvm.so
I/DEBUG   (  189):          #19  pc 00054154  /system/lib/libdvm.so
I/DEBUG   (  189):          #20  pc 00013f98  /system/lib/libdvm.so
I/DEBUG   (  189):          #21  pc 000198e4  /system/lib/libdvm.so
I/DEBUG   (  189):          #22  pc 00018da8  /system/lib/libdvm.so
I/DEBUG   (  189):          #23  pc 0004d850  /system/lib/libdvm.so
I/DEBUG   (  189):          #24  pc 0003a774  /system/lib/libdvm.so
I/DEBUG   (  189):          #25  pc 000296f4  /system/lib/libandroid_runtime.so
I/DEBUG   (  189):          #26  pc 0002a3d8  /system/lib/libandroid_runtime.so
I/DEBUG   (  189):          #27  pc 00008cae  /system/bin/app_process
I/DEBUG   (  189):          #28  pc 0000c54a  /system/lib/libc.so
I/DEBUG   (  189):          #29  pc b0001a46  /system/bin/linker
I/DEBUG   (  189):
I/DEBUG   (  189): code around pc:
I/DEBUG   (  189): ad034504 25001c27 683ce009 d1e92c00 3c14e7f8
I/DEBUG   (  189): ad034514 280068a0 3501d000 2c006824 2000d1f7
I/DEBUG   (  189): ad034524 d0332d00 2c009c00 0069d00b 22002049
I/DEBUG   (  189):
I/DEBUG   (  189): code around lr:
I/DEBUG   (  189): ad0277e8 60a06061 1cb160e3 43281c08 f7e71c3a
I/DEBUG   (  189): ad0277f8 2800ea38 f00dd001 b005fe37 46c0bdf0
I/DEBUG   (  189): ad027808 1c04b510 d0052800 f7e76880 1c20ec3a
I/DEBUG   (  189):
I/DEBUG   (  189): stack:
I/DEBUG   (  189):     be8b4770  ad00f3c0  /system/lib/libdvm.so
I/DEBUG   (  189):     be8b4774  0000e160  [heap]
I/DEBUG   (  189):     be8b4778  400cce70  /dev/ashmem/mspace/dalvik-heap/zygote/0 (deleted)
I/DEBUG   (  189):     be8b477c  4000cae8  /dev/ashmem/mspace/dalvik-heap/zygote/0 (deleted)
I/DEBUG   (  189):     be8b4780  00000001
I/DEBUG   (  189):     be8b4784  ad059d49  /system/lib/libdvm.so
I/DEBUG   (  189):     be8b4788  00000000
I/DEBUG   (  189):     be8b478c  4192193d  /data/dalvik-cache/system@framework@core.jar@classes.dex
I/DEBUG   (  189):     be8b4790  00015e50  [heap]
I/DEBUG   (  189):     be8b4794  00000000
I/DEBUG   (  189):     be8b4798  be8b47b8  [stack]
I/DEBUG   (  189):     be8b479c  4104ee64
I/DEBUG   (  189):     be8b47a0  ad07ff50  /system/lib/libdvm.so
I/DEBUG   (  189):     be8b47a4  00000000
I/DEBUG   (  189):     be8b47a8  4104ee50
I/DEBUG   (  189):     be8b47ac  ad034501  /system/lib/libdvm.so
I/DEBUG   (  189): #00 be8b47b0  00000001
I/DEBUG   (  189):     be8b47b4  0000035c
I/DEBUG   (  189):     be8b47b8  00015de8  [heap]
I/DEBUG   (  189):     be8b47bc  be8b4820  [stack]
I/DEBUG   (  189):     be8b47c0  4104ede8
I/DEBUG   (  189):     be8b47c4  be8b4818  [stack]
I/DEBUG   (  189):     be8b47c8  4000cae8  /dev/ashmem/mspace/dalvik-heap/zygote/0 (deleted)
I/DEBUG   (  189):     be8b47cc  ad054669  /system/lib/libdvm.so
I/DEBUG   (  189): #01 be8b47d0  417602c8 /data/dalvik-cache/system@framework@core.jar@classes.dex
I/DEBUG   (  189):     be8b47d4  ad013f9c  /system/lib/libdvm.so
I/ServiceManager(  187): service 'media.audio_flinger' died
I/ServiceManager(  187): service 'media.player' died
I/ServiceManager(  187): service 'media.camera' died
I/ServiceManager(  187): service 'media.audio_policy' died
D/libEGL  (  771): Setting TLS: 0xafe43b74 to 0xac70a2ec
D/libEGL  (  772): Setting TLS: 0xafe43b74 to 0xac70a2ec
D/AndroidRuntime(  772):
D/AndroidRuntime(  772): >>>>>>>>>>>>>> AndroidRuntime START <<<<<<<<<<<<<<
D/AndroidRuntime(  772): CheckJNI is OFF
D/AndroidRuntime(  772): --- registering native functions ---
I/        (  771): ServiceManager: 0xad08
I/HTC Acoustic(  771): libhtc_acoustic.so version 1.0.1.2.
E/HTC Acoustic(  771): Fail to open /system/etc/AudioPara_TMUS.csv -1.
I/HTC Acoustic(  771): open /system/etc/AudioPara4.csv success.
I/HTC Acoustic(  771): acoustic table version: Dream_TMU_20090305
I/HTC Acoustic(  771): read_audio_para_from_file success.
I/HTC Acoustic(  771): get_audpp_filter
I/HTC Acoustic(  771): open /system/etc/AudioFilter.csv success.
I/HTC Acoustic(  771): ADRC Filter ADRC FLAG = ffff.
I/HTC Acoustic(  771): ADRC Filter COMP THRESHOLD = 2600.
I/HTC Acoustic(  771): ADRC Filter COMP SLOPE = b333.
I/HTC Acoustic(  771): ADRC Filter COMP RMS TIME = 106.
I/HTC Acoustic(  771): ADRC Filter COMP ATTACK[0] = 7f7d.
I/HTC Acoustic(  771): ADRC Filter COMP ATTACK[1] = 3096.
I/HTC Acoustic(  771): ADRC Filter COMP RELEASE[0] = 7ff7.
I/HTC Acoustic(  771): ADRC Filter COMP RELEASE[1] = 4356.
I/HTC Acoustic(  771): ADRC Filter COMP DELAY = 16.
I/HTC Acoustic(  771): EQ flag = 00.
I/HTC Acoustic(  771): get_audpre_filter
I/HTC Acoustic(  771): open /system/etc/AudioPreProcess.csv success.
D/AudioHardwareMSM72XX(  771): mNumSndEndpoints = 48
D/AudioHardwareMSM72XX(  771): BT MATCH HANDSET
D/AudioHardwareMSM72XX(  771): BT MATCH SPEAKER
D/AudioHardwareMSM72XX(  771): BT MATCH HEADSET
D/AudioHardwareMSM72XX(  771): BT MATCH BT
D/AudioHardwareMSM72XX(  771): BT MATCH CARKIT
D/AudioHardwareMSM72XX(  771): BT MATCH TTY_FULL
D/AudioHardwareMSM72XX(  771): BT MATCH TTY_VCO
D/AudioHardwareMSM72XX(  771): BT MATCH TTY_HCO
D/AudioHardwareMSM72XX(  771): BT MATCH NO_MIC_HEADSET
D/AudioHardwareMSM72XX(  771): BT MATCH FM_HEADSET
D/AudioHardwareMSM72XX(  771): BT MATCH HEADSET_AND_SPEAKER
D/AudioHardwareMSM72XX(  771): BT MATCH FM_SPEAKER
D/AudioHardwareMSM72XX(  771): BT MATCH BT_EC_OFF
D/AudioHardwareMSM72XX(  771): BT MATCH CURRENT
D/AudioHardwareMSM72XX(  771): BT MATCH BT_EC_OFF
D/AudioHardwareInterface(  771): setMode(NORMAL)
I/AudioHardwareMSM72XX(  771): Set master volume to 5.
I/CameraService(  771): CameraService started: pid=771
I/AudioFlinger(  771): AudioFlinger's thread 0xce98 ready to run
I/AudioHardwareMSM72XX(  771): Routing audio to Speakerphone
D/HTC Acoustic(  771): msm72xx_enable_audpp: 0x0001
D/AudioHardwareMSM72XX(  771): setVoiceVolume(1.000000)
I/AudioHardwareMSM72XX(  771): Setting in-call volume to 5 (available range is 0 to 5)
I/SamplingProfilerIntegration(  772): Profiler is disabled.
I/Zygote  (  772): Preloading classes...
D/dalvikvm(  772): GC freed 793 objects / 50568 bytes in 6ms
D/dalvikvm(  772): GC freed 251 objects / 16168 bytes in 6ms
D/dalvikvm(  772): GC freed 295 objects / 18768 bytes in 7ms
D/dalvikvm(  772): GC freed 214 objects / 13712 bytes in 8ms
D/dalvikvm(  772): GC freed 415 objects / 26552 bytes in 9ms
D/skia    (  772): ------ build_power_table 1.4
D/skia    (  772): ------ build_power_table 0.714286
D/dalvikvm(  772): GC freed 416 objects / 28336 bytes in 10ms
D/dalvikvm(  772): Trying to load lib /system/lib/libmedia_jni.so 0x0
D/dalvikvm(  772): Added shared lib /system/lib/libmedia_jni.so 0x0
D/dalvikvm(  772): Trying to load lib /system/lib/libexif.so 0x0
D/dalvikvm(  772): Added shared lib /system/lib/libexif.so 0x0
D/dalvikvm(  772): GC freed 2303 objects / 121184 bytes in 13ms
D/dalvikvm(  772): Trying to load lib /system/lib/libmedia_jni.so 0x0
D/dalvikvm(  772): Shared lib '/system/lib/libmedia_jni.so' already loaded in same CL 0x0
D/dalvikvm(  772): Trying to load lib /system/lib/libmedia_jni.so 0x0
D/dalvikvm(  772): Shared lib '/system/lib/libmedia_jni.so' already loaded in same CL 0x0
D/dalvikvm(  772): Trying to load lib /system/lib/libmedia_jni.so 0x0
D/dalvikvm(  772): Shared lib '/system/lib/libmedia_jni.so' already loaded in same CL 0x0
D/dalvikvm(  772): Trying to load lib /system/lib/libmedia_jni.so 0x0
D/dalvikvm(  772): Shared lib '/system/lib/libmedia_jni.so' already loaded in same CL 0x0
D/dalvikvm(  772): GC freed 3790 objects / 197016 bytes in 23ms
D/dalvikvm(  772): GC freed 459 objects / 26008 bytes in 21ms
D/dalvikvm(  772): GC freed 303 objects / 17560 bytes in 22ms
D/dalvikvm(  772): GC freed 204 objects / 11448 bytes in 25ms
D/dalvikvm(  772): GC freed 161 objects / 8728 bytes in 26ms
D/dalvikvm(  772): Trying to load lib /system/lib/libsrec_jni.so 0x0
D/dalvikvm(  772): Added shared lib /system/lib/libsrec_jni.so 0x0
D/dalvikvm(  772): Trying to load lib /system/lib/libsrec_jni.so 0x0
D/dalvikvm(  772): Shared lib '/system/lib/libsrec_jni.so' already loaded in same CL 0x0
D/dalvikvm(  772): GC freed 365 objects / 71664 bytes in 28ms
D/dalvikvm(  772): GC freed 790 objects / 48088 bytes in 39ms
D/dalvikvm(  772): GC freed 331 objects / 38184 bytes in 40ms

a typical memory access error. how it comes?
then run the strace, see any hints

/system/bin/strace –ff –f –t –s 100 –o /dev/null /init
  get IO error

strace -ff -F -tt -s 200 -o /dev/null /init
umovestr: I/O error
umovestr: I/O error
umovestr: I/O error
umovestr: I/O error
umovestr: I/O error
umovestr: I/O error
umovestr: I/O error

I/O error is also a typical error. either caused by physical malfunction, either by code logic.
try switched one new SD card and format it, No luck. that might mean physical disk is good.
then how the code logic.

from the first stacktrace, the jar has been compied and cached to .dex. /data/dalvik-cache/system@framework@core.jar@classes.dex
can I just ask the runtime to recompile the dex.

wipe out those cache.
run “rm –rf /data/dalvik-cache/*.dex”
then “reboot”

error gone, everything works. Applause!
to be safe, I change the acl of thos dex to 111, noboday can override the existing correct dex file.

.net Remoting, Will the static method of MBR be executed on server Only? 32/64 bit clr differs

Last day, I spent two hours to nail down on application bug which is caused by the 32/64 bit inner-process communication patterns. here is the rough outline.

The application is a standard .net remoting application, the .net remoting application has been in the .net platform for almost 7 years. The server side is running on IIS 32 bit process which hosted a Lot of Well-known singlecall/singleton remote objects. 
When one end user startup the Client application on Windows 7 /XP 64 bit, one weird bug said It can’t access some configuraton ( the config should be for Server side only, Now the logic is executed in client, why? Is there something wrong with the .net remoting runtime? ) then I spend hours to make sure both client and server side have applied the latest update. NO luck, still get the error which is caused by Some server side logic been executed on client side.

the logic code looks like this
[Serializable]
   public class RemoteObject : MarshalByRefObject
   {
       static RemoteObject()
       {
           //try to read some server side configuration, web.config
             config= System.Configuration.ConfigurationSettings.AppSettings["serversideconfig"].Trim();
           System.Console.WriteLine("Static Constructor Method of MBR is executed on Process  " + Process.GetCurrentProcess().ProcessName);
       }
for the client side, for sure there is no serversideconfig config, so will get an exception , nullreference.
Why the static method get executed on Client, It should be on server side only. Client is just a wrapper. then I write a mini demo, to identify the pattern. and it’s pretty easy to reproduce the issue. basically, it is caused by the 64 bit CLR. ( samething for .net framework 2.0/3.0/4.0)
Server 32 Bit Server 64 Bit
Client 32bit Server Execution Only Server Execution Only
Client 64bit Client/Server Both Execution Client/Server Both Execution
From this table, it means for 64 Bit Client,  those MBR object, the static constructor method will always be executed both on server side and client side. pretty weird behavior.  but not a big showstopper, once you know, fix it:)
here is the sample test code.


Monday, July 19, 2010

Btrace, get error java.lang.IllegalArgumentException: null ClassLoader when profiling jrockit jvm

As I mentioned in this Blog  Oracle Coherence, Make sure the filter is using the index you created , Btrace is a great tool to tell whether Coherence query is picking up the index or Not. for that case, I just use the Sun hotspot JVM as an example.

If you use Btrace to profiler the jrockit-based cache member, you may get the following errors. ( I tested on windows, no error, but the trace logic never get hit, on Linux get the Null calssloader error.)

java.lang.IllegalArgumentException: null ClassLoader
    at sun.misc.Unsafe.defineClass(Native Method)
    at com.sun.btrace.BTraceRuntime.defineClassImpl(BTraceRuntime.java:1872)
    at com.sun.btrace.BTraceRuntime.defineClass(BTraceRuntime.java:366)
    at com.sun.btrace.agent.Client.loadClass(Client.java:214)
    at com.sun.btrace.agent.RemoteClient.<init>(RemoteClient.java:60)
    at com.sun.btrace.agent.Main.startServer(Main.java:333)
    at com.sun.btrace.agent.Main.access$000(Main.java:61)
    at com.sun.btrace.agent.Main$1.run(Main.java:140)
    at java.lang.Thread.run(Thread.java:619)

Conclusion.
      the Btrace utility doesn’t support jrockit jvm based profiling.

Then How to trace jrockit jvm to to makre sure filter is using the index we created? the short answer is they have a powerful profiling tool called Mission Control.

when you load up the Misson control and connect the cacheserver node. Right click and select “Start Console “

Go to the advanced tab.
  Add one profiler class, “com.tangosol.util.SimpleMapIndex”. then pick up the method we are interested.
image 

then click to run the profiling.
  >>do you insert /update, query, addindex/remove index. you will see the counter keep changing. From the statistics counter, you might know which method get called or not. their performance in terms of timing. and their loading in terms of req/s

image

Friday, July 16, 2010

IE8 JavaScript is disabled / not running after remove McAfee folder ACL

One day, JavaScript will not run on my IE .  how to make sure javascript works? here is the step to run the helloworld test. [ Open a webpage, like google.com, then put “ javascript:alert(“hello world”) “ in the address bar , and click enter. you should get a prompt window if java script works.]

finally, I find it was caused by the McAfee ACL setting. Here is the story,

I just want to disable the McAfee temporally, the easy way is to remove all ACL on the folder, then nobody else can access the folder. for sure, the service fail to start when I reboot the PC.

image


    Then when you try the helloworld test. Nothing returns. Javascript is disabled, it might be  caused by Mcfee indirectly or directly.

to fix it,
         1. Add back the ACL. 
         2. The jscript.dll might be unregistered. run “regsvr32 jscript.dll” in the runbox to make sure it is registered

Thursday, July 15, 2010

asp.net 4.0 , writing Custom outputcache provider for Oracle coherence Memory Cache

One of my Favorite feature of ASP.NET 4.0 is that we can offload the ouputcache from in-Process memory to external storage. i.e Disk, or a big in-memory cache. then we can Cache more Data  instead of being flushed out of memory when asp.net worker process get a lot pressure.  this will be more helpful during the holidays season.

Coherence is one popular in-memory distributed cache cluster. I just spent 30 minutes to build one simple outputcache provider. less than 100 lines of Code. much easier than the diskcache example:)
http://weblogs.asp.net/gunnarpeipman/archive/2009/11/19/asp-net-4-0-writing-custom-output-cache-providers.aspx

Key Points,

  • Keep the object in-memory, we need take care the object serialization /deserialization
    • this can be done easily in .NET. there are 5+ different serializer/formatters
    • I will use the BinaryFormatter which is more space -efficient
  • every cache item has a expiry setting, need flush and purge it when it reaches lifetime settings.
    • Coherence has the overflow setting,
    • you can specify the ttl when inserting object into the cache.

Steps.

  • Setup your distributed Cache Cluster and one dedicated cache.
  • Reference Coherence Assembly and fill up 4 methods which are required by OutputCacheProvider
  • Config asp.net web.config, point the provider to ours.

Setup your distributed Cache Cluster and one dedicated cache. here I will define one cache called outputcache to hold all the cached data.

Build the CoherencCacheOutputCacheProvider.

  • Create one Class library project named CoherencCacheOutputCacheProviderLib
  • reference several dlls.
    • System.web.dll (where OutputCacheProdiver exists)
    • System.configuration
    • Coherence.dll
  • Create one Class named CoherencCacheOutputCacheProvider
  • Compile
  • here is the source code. you may just copy and paste .

change your asp.net application to using the New cache provider.

  • reference the dll we just compiled
  • change the web.config
  • tune you outputcache settings.

here is the web.config

testing and make sure cache works as it should be.

first, I create one simple page just pringout the current time, enable the outputcache and setup duration to 30 seconds. and very by url parameter x

<%@ Page Language="C#" AutoEventWireup="true" CodeFile="testcache.aspx.cs" Inherits="testcache" %>
<%@ OutputCache Duration="30" VaryByParam="x" %>
Last Update :<% =System.DateTime.Now %>

When I browse http://localhost:39847/WebSite1/testcache.aspx?x=1

the runtime will create two cache items, one is the Cachevary, another one is page itself.
image

when try different x value, will get more cached object.

image

the key for the item is url+xvalue.
Let me change the cache logic to vary by browser.
<%@ OutputCache Duration="30" VaryByParam="none" VaryByHeader="user-agent" %>

then try IE/Chrome/Opera.
image

Since we config the cache expiry setting to 30 seconds. so let’s verify the cache item are gone once they get expired.
it is!

image

Conclusion:

asp.net 4.0 provider model is very convenient for extension.  OutputCacheProvider  comes to a citizen of the provervider model.
  just like the coherence session provider for asp.net, it’s plug and play. write once , and enjoy the benefit everywhere.

Tuesday, July 13, 2010

using Btrace to Make sure the filter is using the index you created for Oracle coherence

I am always wondering that Is there any way we can tell the execution plan of the given filter? given the following example.  all in C# code. when the Cache is setup to run in Distributed Mode/Replicated Mode. will the query pickup the index ? will the index get refreshed promptly?
C# sample code,

INamedCache cache = CacheFactory.GetCache(CacheName);
int ctt = 10;
Random rand = new Random();
for (int i = 0; i < ctt; i++)
{
    PurchaseOrder o = new PurchaseOrder();
    o.PoAmount=rand.Next(50000);
    cache.Add( i , o);
}

//Add one Index
INamedCache cache = CacheFactory.GetCache(CacheName);
IValueExtractor extractor = new ReflectionExtractor("getPoAmount");
cache.AddIndex(extractor, true, null);

//Try one Query , like GreatFilter.

INamedCache cache = CacheFactory.GetCache(CacheName);
GreaterFilter filter1 = new GreaterFilter("getPoAmount",10000f);
MessageBox.Show("F" + cache.GetEntries(filter1).Length.ToString() );

I tried several profiling tools. memory profiler,for the question, What’s the memory different after we inserted some objects, and then created some Index. are the replicated mode use different format to store the object. Binary format for the serialized object, or just raw OBJ format.

you can load the jvisualvm.  run two snapshots , and compare it. try searching Index on the comparison report. you will find the following new created objects. Basically, there is one instance called SimpleMapIndex.
  
Then the second question, If there is one Index map, When will the query use it , whether or Not? When will the index get refreshed? say , object update or removal?

Answer: Use Btrace to Inspect the method get called inside SimpleMapIndex.
Here comes my tracing script.

/* BTrace Script Template */

import java.lang.reflect.Field;
import java.util.Map;
import java.util.logging.LogRecord;

import com.sun.btrace.BTraceUtils;
import com.sun.btrace.annotations.*;
import com.tangosol.util.ValueExtractor;

import static com.sun.btrace.BTraceUtils.*;

@BTrace
public class TracingScript {
    /* put your code here */

    @OnMethod(clazz = "com.tangosol.util.SimpleMapIndex", method = "insert", location = @Location(where = Where.BEFORE))
    public static void insert(@Self com.tangosol.util.SimpleMapIndex self,
            Map.Entry a) {
        println("insert Index");
        String s;

    }

    @OnMethod(clazz = "com.tangosol.util.SimpleMapIndex", method = "update", location = @Location(where = Where.BEFORE))
    public static void update(@Self com.tangosol.util.SimpleMapIndex self,
            Map.Entry a) {
        println("update Index");
    }

    @OnMethod(clazz = "com.tangosol.util.SimpleMapIndex", method = "delete", location = @Location(where = Where.BEFORE))
    public static void delete(@Self com.tangosol.util.SimpleMapIndex self,
            Map.Entry a) {
        println("Delete Index");

    }

    // Who is querying index content
    @OnMethod(clazz = "com.tangosol.util.SimpleMapIndex", method = "getIndexContents", location = @Location(value = Kind.RETURN))
    public static void getIndexContents(
            @Self com.tangosol.util.SimpleMapIndex self, @Return Map map) {
             Field msgField = field("com.tangosol.util.SimpleMapIndex", "m_extractor");

        println("getIndexContents");
        println("------------index used ---------------");
        Object o=get(msgField,self);
        println( str(o));
        printFields(o);
        Class cz=classForName("com.tangosol.util.extractor.AbstractCompositeExtractor");
        if(isInstance(cz,get(msgField,self) ))
        {
            println("++++++++++++++++++++++++Chained+++");
            //dump chanied fields;
            Field f2 = field("com.tangosol.util.extractor.AbstractCompositeExtractor", "m_aExtractor");
            Object [] rfs=(Object[])get(f2,o);
            println(BTraceUtils.strcat("Chain Count: ", str(rfs.length)));
            int i=0;
            if(i<rfs.length)
            {
            printFields(rfs[i]);
            i++;
            }
            if(i<rfs.length)
            {
            printFields(rfs[i]);
            i++;
            }
            if(i<rfs.length)
            {
            printFields(rfs[i]);
            i++;
            }
            if(i<rfs.length)
            {
            printFields(rfs[i]);
            i++;
            }

            println("++++++++++++++++++++++++Chained+++");
        }

        println("------------index used ---------------");
        jstack();
    }

}

you may just copy this scipt, and save it to a local folder as TracingScript.java.

run jps to get the cacheserver PID.

   Btrace –cp “path of the coherence.jar” PID “pathofthe sciprt”

then try running the cache in different Mode, i.e replicated mode vs distributed mode.

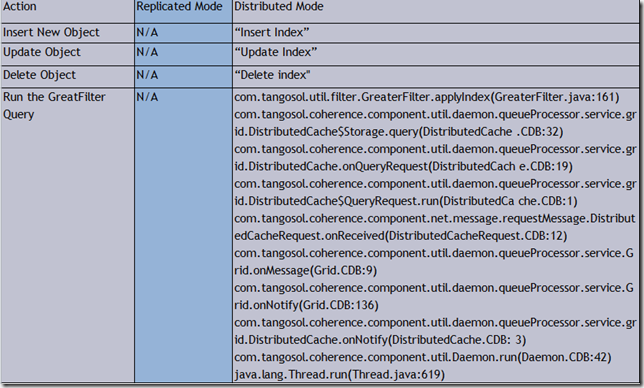
Answer is interesting, For replicated Mode. all query never pickup the Index.

image

More Coherence Blogs:

Monday, July 12, 2010

Keep Your Windows 7 boot camp and Mac time in Sync , turn off /down the annoying startup sound

If you are using windows and Mac ( a dual boot on a macbook), you may have noticed that time setup is always inconsistent between the two OSs. for me , always a 8 Hours difference. Why? that’s because Mac/Windows use different internal format to record the current time. UTC vs Local time (Pacific time for me, that explains the 8 hours difference.)

Here is the step to override the windows setting and make sure it use the UTC format as Mac does.

  • Starup windows and setup the registry
    • launch “Regedit.exe”
    • open the rg key ”HKEY_LOCAL_MACHINE\SYSTEM\CurrentControlSet\Control\TimeZoneInformation”
    • Create a new key called RealTimeIsUniversal (case-sensitive!, Type is REG_DWORD), set up value to 1
    • for windows X64 version, Create an extra new key called RealTimeIsUniversal (case-sensitive!, Type is REG_QWORD), set up value to 1
  • shutdown windows and switching back to MAC
  • correct your time settings
  • Done. the two OS time should keep sync then

Some reference,
Criticism of Microsoft Windows Clock management
How to Modify windows registry


Turn of the annoying startup sound of macbook

It will be Ideal if you see this in the system preference panel.

Startup Sound preference pane

thanks to ARCANA, there is one 3rd party add-in that enable you do this.

basicaly, download and install this bits from http://www5e.biglobe.ne.jp/~arcana/software.en.html#StartupSound , Make sure always download the latest version. 
once installed, when open system preference, you will be able to see the startup sound panel. then enjoy the setting! No more annoying startup sound.

image

Friday, July 9, 2010

Oracle Coherence, java.lang.IllegalArgumentException: Unsupported key or value

When I define one replicated cluster, and Setup the unit-calculator to binary. hopefully, from the Coherence Mbeans, I should be able to see the object size vs units. By default, size is the same with unit.  When I put some data to the replicated cluster. From the cluster jvm console, I get the following Errors.  the cache extend client didn’t get any error. But when you query the cluster, No objects founds. they are all gone.

2010-07-09 15:50:47.790/300.414 Oracle Coherence GE 3.5.3/465 <Error> (thread=ReplicatedCache, member=1):
java.lang.IllegalArgumentException: Unsupported key or value: Key=9, Value=ID 9PMName PM9PoAmount   135.0PoNumber  null
       at com.tangosol.net.cache.BinaryMemoryCalculator.calculateUnits(BinaryMemoryCalculator.java:43)
        at com.tangosol.net.cache.OldCache$Entry.calculateUnits(OldCache.java:2397)
        at com.tangosol.net.cache.OldCache$Entry.onAdd(OldCache.java:1990)
        at com.tangosol.util.SafeHashMap.put(SafeHashMap.java:244)
        at com.tangosol.net.cache.OldCache.put(OldCache.java:266)
        at com.tangosol.coherence.component.util.CacheHandler.onLeaseUpdate(CacheHandler.CDB:45)
        at com.tangosol.coherence.component.util.daemon.queueProcessor.service.grid.ReplicatedCache.performUpdate(Replic
atedCache.CDB:11)
        at com.tangosol.coherence.component.util.daemon.queueProcessor.service.grid.ReplicatedCache.onLeaseUpdateRequest
(ReplicatedCache.CDB:22)
        at com.tangosol.coherence.component.util.daemon.queueProcessor.service.grid.ReplicatedCache$LeaseUpdateRequest.o
nReceived(ReplicatedCache.CDB:5)
        at com.tangosol.coherence.component.util.daemon.queueProcessor.service.Grid.onMessage(Grid.CDB:9)
        at com.tangosol.coherence.component.util.daemon.queueProcessor.service.Grid.onNotify(Grid.CDB:136)
        at com.tangosol.coherence.component.util.daemon.queueProcessor.service.grid.ReplicatedCache.onNotify(ReplicatedC
ache.CDB:3)
        at com.tangosol.coherence.component.util.Daemon.run(Daemon.CDB:42)
        at java.lang.Thread.run(Thread.java:619)

What does this error means?  it looks like there are something wrong with the BinaryMemoryCalculator.calculateUnits

what’s the logic in this method. we can turn to JD-GUI [ java decompilers, like the .net reflector. ] I get the code here

/*    */   public int calculateUnits(Object oKey, Object oValue)
/*    */   {
/* 35 */     if ((oKey instanceof Binary) && (oValue instanceof Binary))
/*    */     {
/* 37 */       return padMemorySize(SIZE_ENTRY + 2 * SIZE_BINARY + ((Binary)oKey).length() + ((Binary)oValue).length());
/*    */     }
/*    */
/* 43 */     throw new IllegalArgumentException("Unsupported key or value: Key=" + oKey + ", Value=" + oValue);
/*    */   }

cache configuration

  <replicated-scheme>
      <scheme-name>repl-default</scheme-name>
      <service-name>ReplicatedCache</service-name>
      <serializer>
        <class-name>com.tangosol.io.pof.ConfigurablePofContext</class-name>
      </serializer>
      <lease-granularity>member</lease-granularity>
      <backing-map-scheme>
        <local-scheme>
        <unit-calculator>BINARY</unit-calculator>
        </local-scheme>
      </backing-map-scheme>
      <autostart>true</autostart>
    </replicated-scheme>

So the error means either Key or Object is not a Binary type. How comes it is not a Binary? the system controls the internal storage.

how about dumping out the class type of key and the value?

BTrace is my friend then , basically, I want to print out the class of okey/ovalue before the method get called. 

here is the Btrace script

/* BTrace Script Template */

import com.sun.btrace.BTraceUtils;
import com.sun.btrace.annotations.*;
import com.tangosol.net.cache.*;
import static com.sun.btrace.BTraceUtils.*;

@BTrace
public class TracingScript {
    /* put your code here */
    @OnMethod(clazz="com.tangosol.net.cache.BinaryMemoryCalculator",method="calculateUnits",location=@Location(where=Where.BEFORE))
        public static void oncalculateUnits(@Self com.tangosol.net.cache.BinaryMemoryCalculator self,
                Object a, Object b) {
        print("a  ");
        println( a);
        println(  BTraceUtils.classOf(a));
        print("b  ");
        println( b);
        println(  BTraceUtils.classOf(b));
     }
}

then your can trace the cacheserver either by startuping btrace.bat pidofthejvm pathoftrace.java, or using btrace plugin for jvisualvm

as the error implys, it do store the object as the native format instead of the binary format


a  98
class java.lang.Integer
b  POFLib.PurchaseOrder@12fc61a
class POFLib.PurchaseOrder
a  99
class java.lang.Integer
b  POFLib.PurchaseOrder@cef65
class POFLib.PurchaseOrder

if I change the cachem schema back to distributed. No error, and the object is stored as Binary format.

a  com.tangosol.util.Binary@153b2cb
class com.tangosol.util.Binary
b  com.tangosol.util.Binary@1ff2e1b
class com.tangosol.util.Binary

C# code

INamedCache cache = CacheFactory.GetCache("repl-customer");
                      PurchaseOrder o = new PurchaseOrder();
                   o.ID = i;
                   o.PMName = "PM" + i;
                    o.PoAmount=rand.Next(50000);
                   cache.Add( i , o);


conclusion:

  • if you use the replicated cache. the unit-calculator has to be Fixed.
  • Objects is stored in different format. Native vs Binary  for replicated mode and distributed mode
  • if Object is stored in native format, will there be more footprint?
  • replicated mode doesn’t support Index, check the blog here.

Cannot read NBM, com-sun-btrace.nbm

Jvisualvm is a great tool even for developers. Brace is on popular profiling tool which enable you to add some profiling logic to the existing jvm. Like dump out the variable passed to the given method.

Btrace has one plugin for jvisualvm, if you followed this link https://btrace.dev.java.net/visualvm_uc.html.

you may get an error, something like cannot read NBM, network issue.

image

the server is definitely available.   3 nbms have been downloaed to that folder.

Now, you need change the plug-in update address to http://btrace.kenai.com/uc/visualvm/updates.xml

then reload the catalog and click to install the plug-in. easy you profiling

image

Thursday, July 8, 2010

Android: Showing indeterminate progress bar / TabHost activity setProgressBarIndeterminateVisibility

Code is pretty simple. request the feature , toggle the Visibility.

import android.app.Activity;
import android.os.Bundle;
import android.view.View;
import android.view.Window;
import android.view.View.OnClickListener;
import android.widget.Button;
import android.widget.LinearLayout;

public class DemoActivity extends Activity {
    @Override
    protected void onCreate(Bundle savedInstanceState) {
        // TODO Auto-generated method stub
        super.onCreate(savedInstanceState);
        requestWindowFeature(Window.FEATURE_INDETERMINATE_PROGRESS);
        Button b =new Button(this);
        b.setText("Click to start spinning");
        b.setOnClickListener(new OnClickListener(){

            @Override
            public void onClick(View v) {
                DemoActivity.this.setProgressBarIndeterminateVisibility(true);
            }});
        Button c =new Button(this);
        c.setText("Click to STOP spinning");
        c.setOnClickListener(new OnClickListener(){

            @Override
            public void onClick(View v) {
                DemoActivity.this.setProgressBarIndeterminateVisibility(false);
            }});
        LinearLayout l=new LinearLayout(this);
        l.addView(b);
        l.addView(c);
        this.setContentView(l);
    }
}

image

if you use a TabActivity as a parent, and your logical activity is a child of the parent. you need request the feature in the onCreate method of TabActivity.

in your logical activity, call the getparent to get the access of the parentactivity reference.

So code will be

Parent(TabActivitity)
requestWindowFeature(Window.FEATURE_INDETERMINATE_PROGRESS);

your child activity
((taballActivity)this.getParent()).setProgressBarIndeterminateVisibility(true);

if your logic runing in a different thread other than Main ui thread.

ChildActivity.this.runOnUiThread(
                            new Runnable()
                            {

                                public void run() {
                                    // TODO Auto-generated method stub
                                    ((taballActivity)ChildActivity.this.getParent()).setProgressBarIndeterminateVisibility(false);
                                }

                            }
                    );


Sunday, July 4, 2010

android update, flash_image not found

When you’ve already rooted your Nexus one like me,  you may noticed that even Google Push the update 2.2 to you device over OTA, you end up with a screen has a ! in the triangle.

image

Just Search “Install android 2.2 on rooted nexus one”, you may get tens of blogs.

I just follow on link here, http://www.redmondpie.com/how-to-install-android-2.2-froyo-on-nexus-one-with-root-9140788/

when I hold power/volum+ to the recovery mode, I don’t have the chose of Flash zip from SDK as mentationed in the blog

image

I only have 4 choices. as bellow

image


then I figure out we need to install recovery-RA-nexus which has the flash zip from sdcard features.

when you download the recovery-RA-nexus-xx.img, you need a utility called flash_image to load the imge to recovery partition.  http://android.modaco.com/content/google-nexus-one-nexusone-modaco-com/299241/24-feb-1-6-2-ra-nexus-recovery-image/When I try this , it looks like there is no flash_image command in my system.

Finally , here is one step to port the utility to phone devices.

Download the flash_image.zip and unzip to your PC folder. install the ADB from Android Sdk site. then you will be able to run adb command

adb root
This will start ADB as root, or notify if it is already running as root. 
adb remount
This will mount the system partition (/system) as writable, allowing the following
adb push flash_image /system/bin
This will send the flash_image script into the /system/bin, so we can use it from within the shell
adb shell chmod 0755 /system/bin/flash_image
Finally, change the permissions of the script to allow it to perform the desired action. Now that the script is installed, we are ready to proceed with flashing the custom recovery, saved on the root of the SD card earlier:
adb shell flash_image recovery /sdcard/recovery.img


then run “reboot recovery” , the phone will be rebooted to recoery mode. you will be able to run the option called “Flash zip from sd card”

Hope you can get the following screen like me.


image

 
Locations of visitors to this page