I’ve always looking for some 3rd party tools to visualize the JVM GC , It turns out some great tool has been part of the java 6 SDK [so remember to use the jdk 1.6 , nee 1.5/1/4]. visualVM is part of the toolsets.
Just go to bin directory of the SDK, and Run “JvisualVM”, the GUI tool showing the general view of Threads, Heap will popup
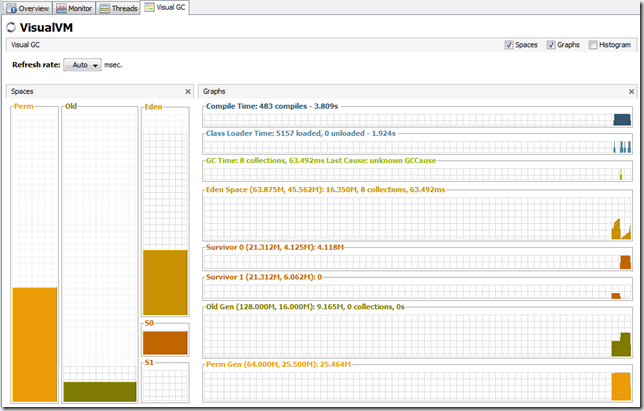
however you can’t see the detailed GC details. Like the S1/S2 , Eden space , Survior space /Perm Space.
now, time to turnon the visualGC. Just click the tools->plugin and Select to enable the visualgc plugin.
check the visualGC , accept terms and install the plug-in. then Restart the jvisualvm
in the visual GC tab, you get the detailed inside of the heapspace. with the time goes on, you can see eden space get collected and copied to s0/s1, when s0 is filled up, compact to s1/s0, then goes to old space.
what a great plug-in.
Some links here: VisualGC options and filed descriptions. http://java.sun.com/performance/jvmstat/visualgc.html
Try some parameters and verify it works?
•A+B+C=Young Age
•D=Old Age
•E=Per Age
•Size of B == Size of C
•D/(A+B+C)= -XX:NewRatio
•A/B or A/C= -XX:SurvivorRatio
you can tell from the description.
I setup the -XX:NewRatio=10, which will increase the Old space quota. you can do some math here
454.562 /(36.4+4.5+4.5)=10 here.
Dump the Heap?
her is one sample code, that I keep creating Persons which has an Address object. then release the reference periodically. when you dump the heap, you may see their instances keep jumping up and down
or just enable the Sample on Memory and put a filter in the bottom.
heap Walker?
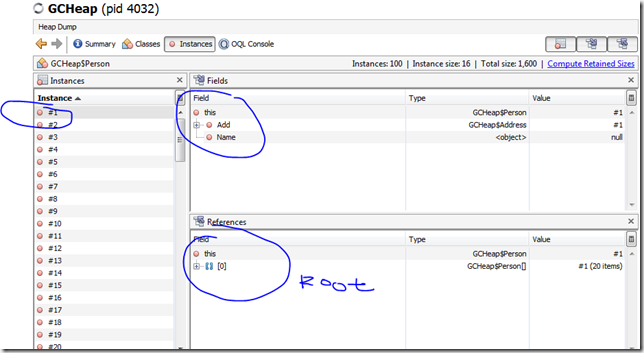
Is the data correct? what’s the root for those junk data. Heap walker is the answer.
after you dump the heap, double click the Class that you are interested. like the Person Here. you get the root of this object, and you can drill up to the Top root
show GCRoot,those are the key point for potential Memory leak
when you right click one instance in the references list, click show neareast gc root.
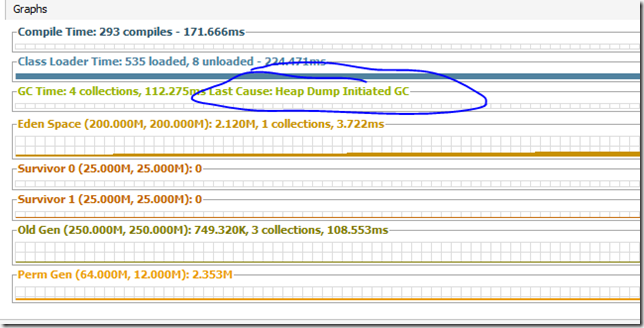
Remember that when you click heap dump, it will trigger a GC. in the last gc secion, you can see one note called ‘heap dump initiated GC”. so you won’t be able to see the “dirty” objects.
here, aaa is a static field of a class. so static class loader is the GC root.
Sample Code is attached here.
| import java.io.IOException; public class GCHeap {
private static class Person public Address Add; private static class Address } |
Other Blogs about Java monitoring.


No comments:
Post a Comment