Wednesday, June 23, 2010

Installing Oracle coherence .bat file as Windows Service

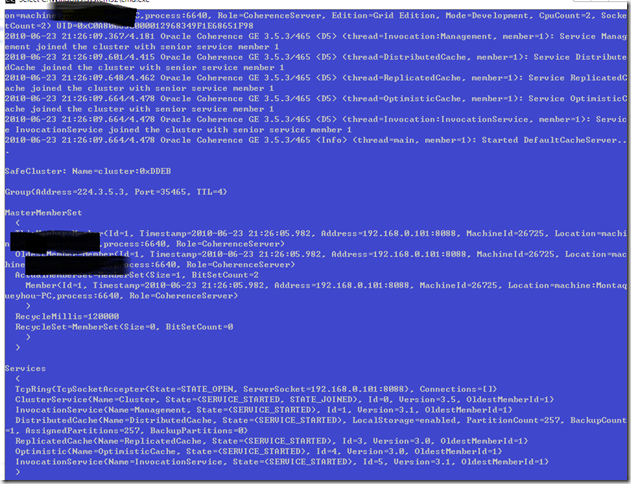
When you get the oracle coherence bit,there is one bootstrap file located in coherence\bin\cache-server.cmd  , when you run that , a command prompt will show up. and you need keep it open otherwise the clustering service will be closed. So how to make it runs as a windows service?

image 

Here is the steps to install it as a windows service, so the cluster service will be started up when the machine boot up.

1. Get the Parameters to run the Java Application. when you start up the bat file, the runtime will fire up one jave process with giving parameters. you need get those parameters.

how to get the parameters on windows, If you runs on windows vista or 7 or 2008. just right click the taskmanager, turn on the commandline column by selecting View->select Columns->Command Line.

image

for windows  Xp ,or 2003.  you can get this by querying the WMI

Run WMIC on the command prompt, and key in “process where name=”java.exe” get commandline

image

so for this example the full commandline is .

full commandline "c:\jdk1.6.0_20\bin\java"  -server -showversion ""-Xms512m -Xmx512m"" -cp "C:\tangosol-33\coherence\bin\\..\lib\coherence.jar" com.tangosol.net.DefaultCacheServer
JDK "c:\jdk1.6.0_20\bin\java"
classpath C:\tangosol-33\coherence\bin\\..\lib\coherence.jar
jvm parameters -server -showversion ""-Xms512m -Xmx512m""
main class com.tangosol.net.DefaultCacheServer

2. download the javaservice . http://forge.ow2.org/project/showfiles.php?group_id=137&release_id=1560
please note, if your using 64 bit jvm, chose the amd64 zip version of javaservice. then unzip the file, copy the javaservice.exe to the coherence\bin folder. you may rename it as coherence.exe.

3. install one windows service by assign the paramters to coherence.exe. 
  

C:\tangosol-33\coherence\bin>coherence.exe -install MyServiceName "C:\jdk1.6.0_20\jre\bin\server\jvm.dll" -server -showv
ersion ""-Xms512m -Xmx512m"" -Djava.class.path="C:\tangosol-33\coherence\bin\\..\lib\coherence.jar" com.tangosol.net.Def
aultCacheServer -err "c:\tangosol-33\coherence\bin\err.log" -start com.tangosol.net.DefaultCacheServer

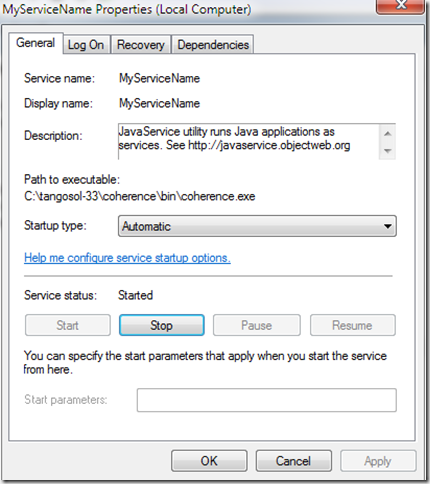
then you will be able to see a service named myservicename in services console.

image

4. troubleshooting. you may get error to startup the service. always check the following list.

  • Windows Event Log, if you mess up the jvm 32/64 version, you may get the error like

    “LoadLibrary is not a valid Win32 application.” which means you jdk is 32bit, but javaservice is 64 bit.

  • check the error log file that you specified in the –err parameter.
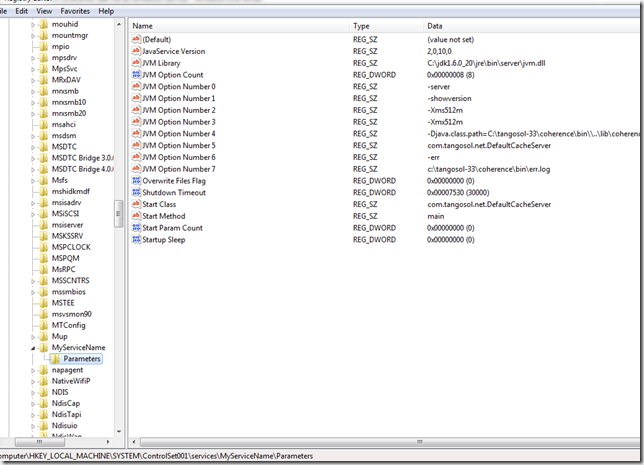
  • you may tweak the parameters, which is located in HKEY_LOCAL_MACHINE\SYSTEM\ControlSet001\services\MyServiceName

image

just change those parameters directly, then restart the service see whether the error will disappear

hope it helps.

some reference

javaservice: http://forge.ow2.org/project/showfiles.php?group_id=137&release_id=1560

Oracle coherence: http://www.oracle.com/technology/products/coherence/index.html

Oracle coherence Book, great book from the core team
Tuesday, June 15, 2010

Fix the classpnp.sys problem, Windows 7 SSD macbook

After I did a lot pressure on CPU performance testing, My windows 7 64 bit [macbook, OCZ SSD, 64 bit ultimate edition]become no responding at all. then I just hold the power key and force a reboot. Sadly enough, it even can’t boot up. Press F8 to try the safemode, no Luck . Get an error like this,  one system driver can’t be loaded. Always, It means the file is corrupt and All you need to fix is find a way to replace the file.

alt

Here is How-to, It is proved to work great on my Macbook win 7 74 bit.

  1. Copy the Classpnp.sys file from another PC to an external hd or USB drive. PLEASE Note, 32 bit /64 bit system differs. Make sure you get the same version as you OS.
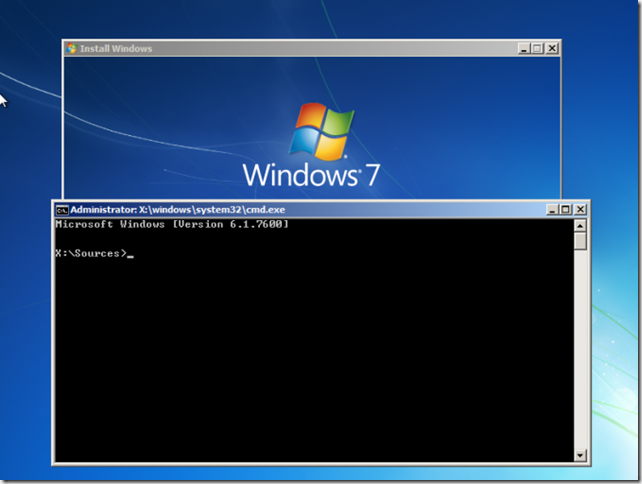
  2. Insert one windows DVD to the dvdrom, try boot with the DVD, to setup a New OS (don’t click to go further, all we need is just a command promot that we can copy the file from USB to your Primary HD), For MACbook, Hold and Press “C” to initial the setup.
  3. after the setup GUI is loaded, Run “Shift + F10” to Bring a Command Prompt, this feature has been in the Windows setup GUI since win 2000. So for step 2, inserting any version of windows is fine.

Shift-F10

  1. Copy the file from your backup drive to \windows\system32\drivers\classPNP.sys
  2. remove the DVD and external HD, restart the PC
  3. if you get a hint to Repair the PC, forget it. Not make any sense here. until now, all will be fixed.


For more troubleshooting entries.

Monday, June 14, 2010

Troubleshooting High 100% CPU utilization

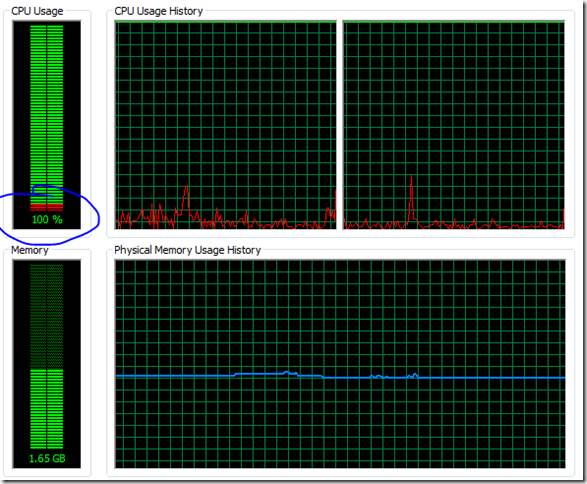
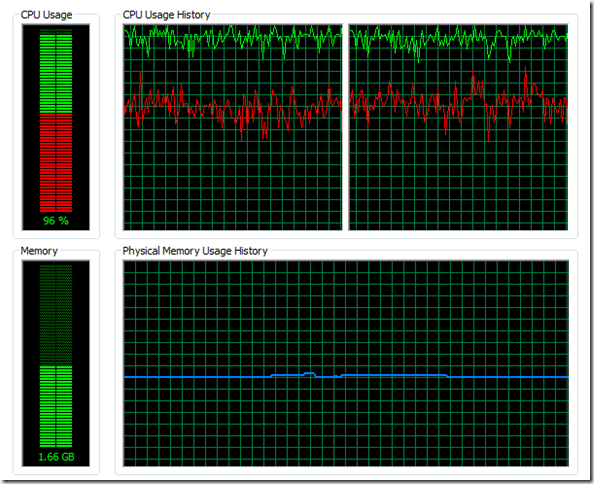
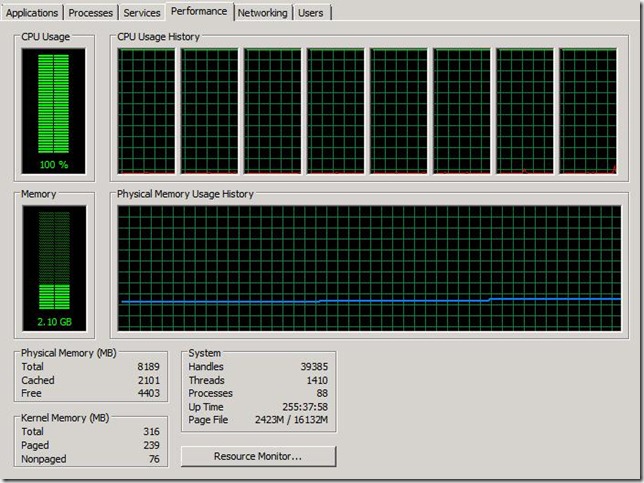
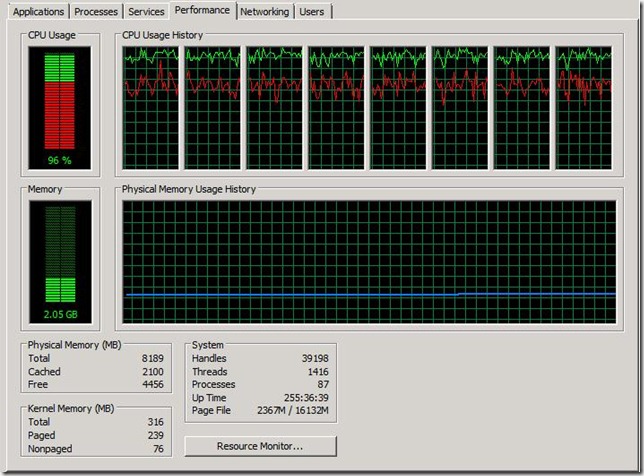
When I open windows task manager it says that CPU usage is at 100%. Even I have enough Memory, CPU cores. What happened under the hood? Before you dig more, remember to Show the Kernel time vs User time.  [Click View->Show kernel times], then you will see some spikes in red. The Percentage of the red really means a lot. Here is two snapshoot. It’s a live snapshoot I captured. You may see the source code at the end of the blog.

c1

CPU 100%, Kernel time is less than 5% percent.

c2

Same 100% CPU, Kernel time is over 60%.

even I change the app to run a more powerful machine. with 8 Cores, Xeron CPU.

NODISK


IO

in this specific case, CPU is extremely busy, Memory looks good (no spike, and still at lot free RAM available.), What are those resources drained a lot CPU?  for those kernel things, they might be the following types

  • DISK I/O, Check the VMstat or disk queue length in windows, Driver issue?
  • Network I/O.  (DB connection, lot round-trip call?)
  • Thread context switching. ( Locks, contention. quantum management.), you can check the cs in vmstat , In windows, using the performance counter System->Context Switches/sec
    • System\Context Switches/sec, which measures how frequently the processor has to switch from user- to kernel-mode to handle a request from a thread running in user mode. The heavier the workload running on your machine, the higher this counter will generally be, but over long term the value of this counter should remain fairly constant. If this counter suddenly starts increasing however, it may be an indicating of a malfunctioning device, especially if you are seeing a similar jump in the Processor(_Total)\Interrupts/sec counter on your machine.

image

if you want to reproduce the above CPU usage. here is the C# source code.

Comment or uncomment the link of ReadFile("c:\\windows"); will make a big difference. in this code, the read time is spent by Disk I/O.

namespace ConsoleApplication4
{
    class Program
    {
        static volatile int iiii = 0;
        static void Main(string[] args)
        {
            System.Net.ServicePointManager.MaxServicePoints = 1000;
            int count = 40;
            Thread[] trs = new Thread[count];
            for (int i = 0; i < count; i++)
            {
                trs[i] = new Thread(Func);

            }

            for (int i = 0; i < count; i++)
            {
                trs[i].Start();

            }

            Console.ReadLine();
        }

        static void Func(object o)
        {
            while (true)
            {
                for (int i = 0; i < 10000; i++)
                {
                    iiii += 2;
                    try
                    {
                        ReadFile("c:\\windows");
                    }
                    catch
                    {
                    }
                }

            }
        }

        private static void ReadFile(string Dir)
        {

            foreach (String f in System.IO.Directory.GetFiles(Dir))
            {
                string D = f;
            }
            foreach (string folder in System.IO.Directory.GetDirectories(Dir))
            {
                ReadFile(folder);
            }
        }

    }
}

reference

Key Performance Monitor Counters http://www.windowsnetworking.com/articles_tutorials/Key-Performance-Monitor-Counters.html
vmstat command : http://publib.boulder.ibm.com/infocenter/aix/v6r1/index.jsp?topic=/com.ibm.aix.prftungd/doc/prftungd/vmstat_command.htm

Wednesday, June 9, 2010

GC Log Visulation, HPJmeter

Jon has a great blogging about different JAVA gc collections. check the link : http://blogs.sun.com/jonthecollector/entry/our_collectors, basically it means different Collector means different   young age / old generation collection behavior.

Each blue box represents a collector that is used to collect a generation. The young generation is collected by the blue boxes in the yellow region and the tenured generation is collected by the blue boxes in the gray region.

  • "Serial" is a stop-the-world, copying collector which uses a single GC thread.
  • "ParNew" is a stop-the-world, copying collector which uses multiple GC threads. It differs from "Parallel Scavenge" in that it has enhancements that make it usable with CMS. For example, "ParNew" does the synchronization needed so that it can run during the concurrent phases of CMS.
  • "Parallel Scavenge" is a stop-the-world, copying collector which uses multiple GC threads.
  • "Serial Old" is a stop-the-world, mark-sweep-compact collector that uses a single GC thread.
  • "CMS" is a mostly concurrent, low-pause collector.
  • "Parallel Old" is a compacting collector that uses multiple GC threads.

    Using the -XX flags for our collectors for jdk6,

  • UseSerialGC is "Serial" + "Serial Old"
  • UseParNewGC is "ParNew" + "Serial Old"
  • UseConcMarkSweepGC is "ParNew" + "CMS" + "Serial Old". "CMS" is used most of the time to collect the tenured generation. "Serial Old" is used when a concurrent mode failure occurs.
  • UseParallelGC is "Parallel Scavenge" + "Serial Old"
  • UseParallelOldGC is "Parallel Scavenge" + "Parallel Old"
  • given different options, you need to compare and balance the different tradeoffs. like latency, responsetime, low footprint. etc.  How to make sure which one fits you? HPJmeter is your friend to tell that.

    How it works. 
      Turn on GC log which will enable the jvm to dump GC detailed information to a Logfile. try different colelctors, then you get the result matrix. HPJmeter has the feature to compare several log files. then you can compare the GC time, Heap Allocation.

    for example, Like me, I want to compare the ParallenGC vs the Concurrent GC. here is how it do it.
    download HPJmeter from HP, it’s a free tool.

    then enable the gc loging and try different switch. here is two options I tried

    java -XX:+UseParallelGC  -Xloggc:gcParallelGC.log MyApplication

    java -XX:+UseConcMarkSweepGC  -Xloggc:gccms.log MyApplication

    after run the app for a while, you get enough gc information and stop you app. two logs are generated. they are basically text file and has a fixed format.

    0.158: [GC 20544K->18152K(32192K), 0.0062129 secs]
    0.185: [GC 22312K->19728K(36352K), 0.0103363 secs]
    0.236: [GC 28048K->22500K(36352K), 0.0135180 secs]
    0.250: [Full GC 22500K->5706K(27264K), 0.0271364 secs]


    clock time :{gc type, before->after, pause time]

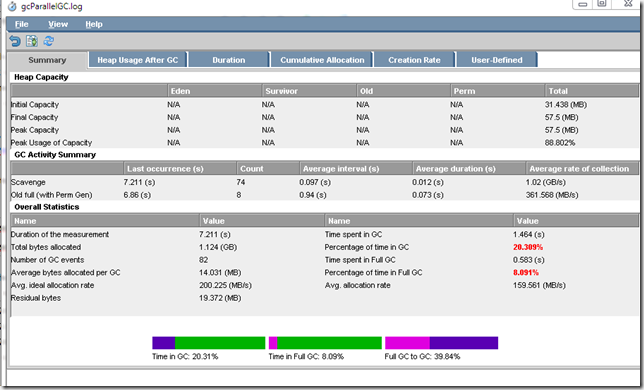
    start the HPJmeter, and open the log you just collected. there are several tabls that show you the summary /Heap usage/Duration,etc

    image

    the above summary tells the ParallelGC does’t work well in my application. 20% of CPU time is spent on GC collection. and several FULL GCs which is CPU intensive has been invoked.
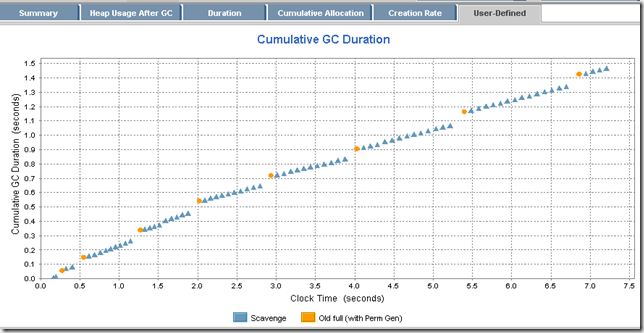
    then click the user-defined tab and select cumulative GC, it shows the GC time vs the clock time

    image

    of course, the less time spent on GC, the more you app get responsive.

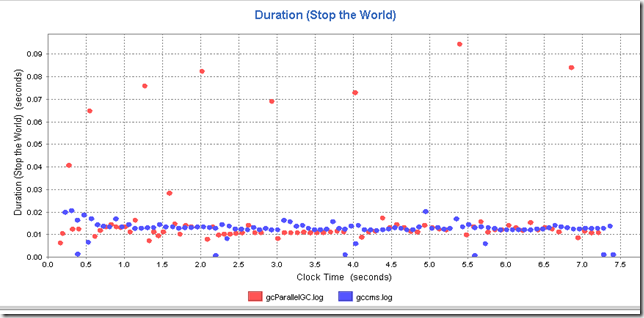
    now time to compare with the Concurrent collectors. CLick the File->compare to load another log file.

    image

    the CMS with Concurrent Collector wins, it takes less time . test it , and the chart tells. 

    Tuesday, June 8, 2010

    VisualGC plugin ,VisualVM

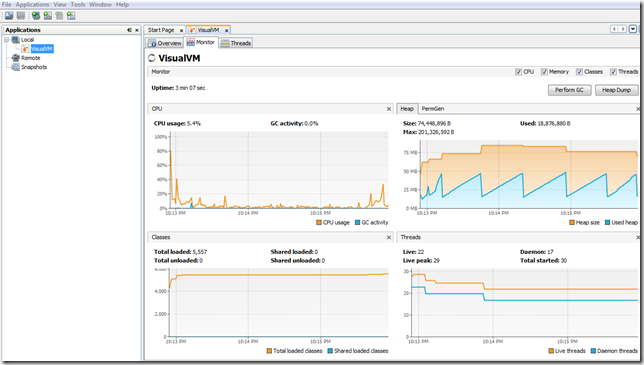
    I’ve always looking for some 3rd party tools to visualize the JVM GC , It turns out some great tool has been part of the java 6 SDK [so remember to use the jdk 1.6  , nee 1.5/1/4].  visualVM is part of the toolsets.

    Just go to bin directory of the SDK, and Run “JvisualVM”, the GUI tool showing the general view of Threads, Heap will popup

    image

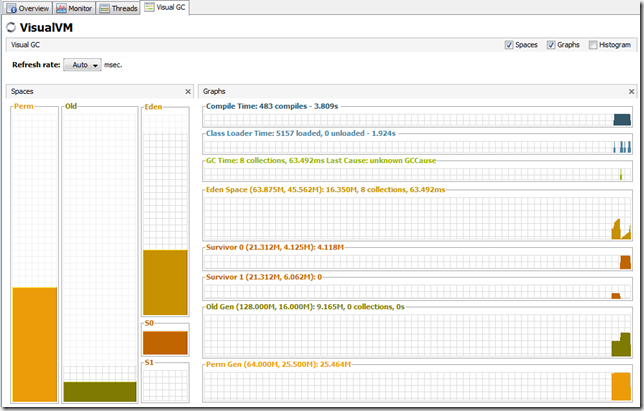
    however you can’t see the detailed GC details. Like the S1/S2 , Eden space , Survior space /Perm Space.

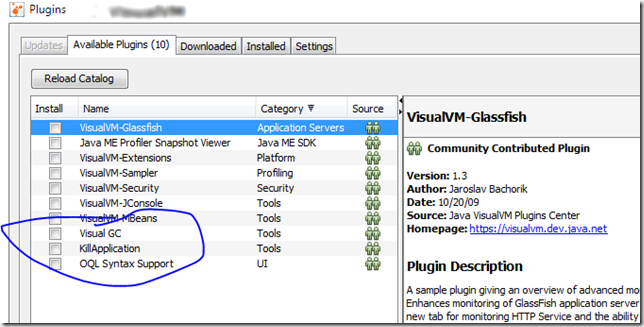
    now, time to turnon the visualGC. Just click the tools->plugin and Select to enable the visualgc plugin.

    image

    check the visualGC , accept terms and install the plug-in. then Restart the jvisualvm

    image

    in the visual GC tab, you get the detailed inside of the heapspace. with the time goes on, you can see eden space get collected and copied to s0/s1, when s0 is filled up, compact to s1/s0, then goes to old space.

    what a great plug-in.

    Some links here: VisualGC options and filed descriptions. http://java.sun.com/performance/jvmstat/visualgc.html

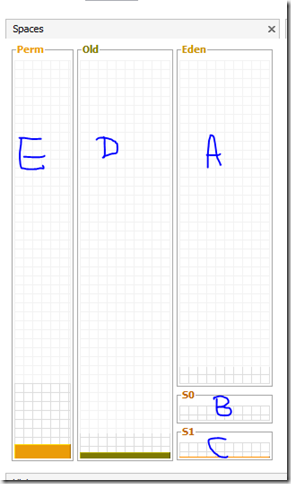
    Try some parameters and verify it works?

    image

    •A+B+C=Young Age

    •D=Old Age

    •E=Per Age

    •Size of B == Size of C

    •D/(A+B+C)= -XX:NewRatio

    •A/B or A/C= -XX:SurvivorRatio

    you can tell from the description.

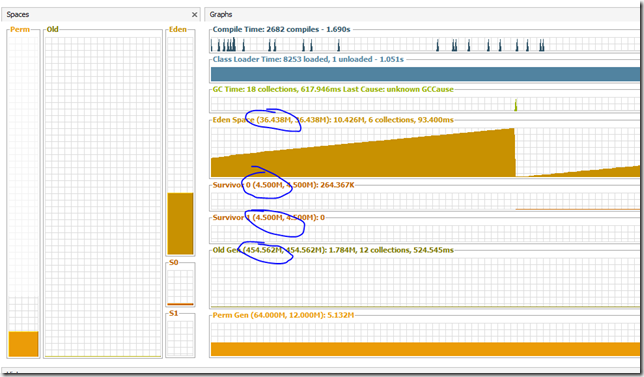
    image

    I setup the -XX:NewRatio=10, which will increase the Old space quota. you can do some math here

    454.562 /(36.4+4.5+4.5)=10 here.

    Dump the Heap?

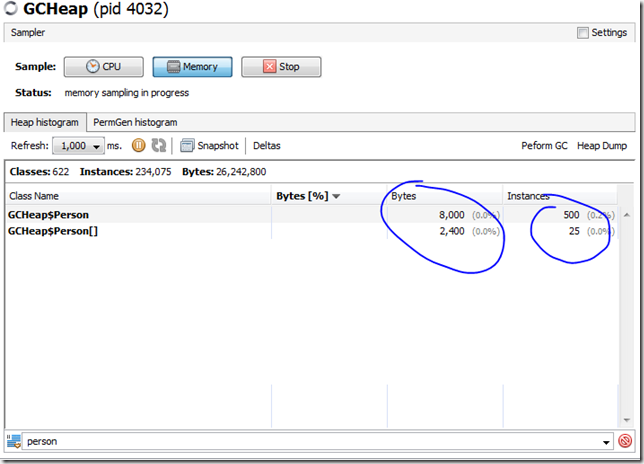
    her is one sample code, that I keep creating Persons which has an Address object. then release the reference periodically. when you dump the heap, you may see their instances keep jumping up and down

    image

    or just enable the Sample on Memory and put a filter in the bottom.

    image

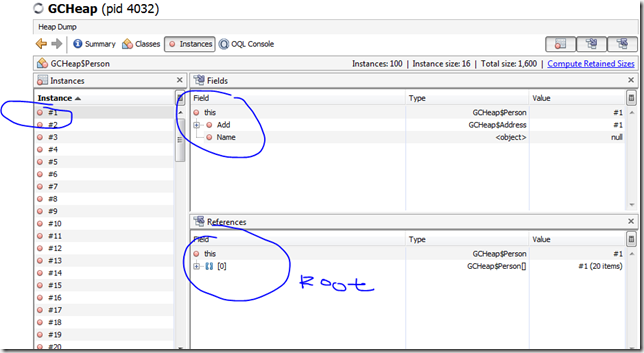
    heap Walker?

    Is the data correct? what’s the root for those junk data. Heap walker is the answer.

    after you dump the heap, double click the Class that you are interested. like the Person Here. you get the root of this object, and you can drill up to the Top  root

    image

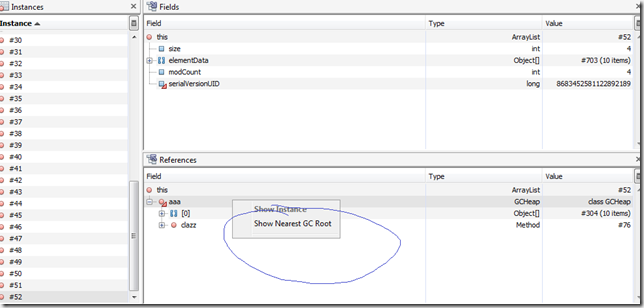
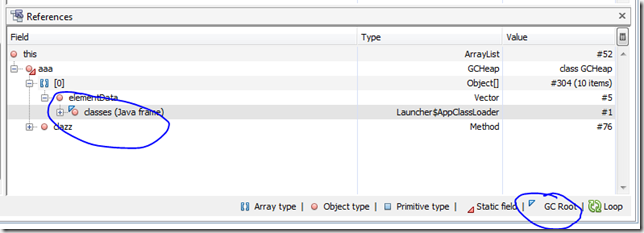
    show GCRoot,those are the key point for potential Memory leak

    when you right click one instance in the references list,  click show neareast gc root.
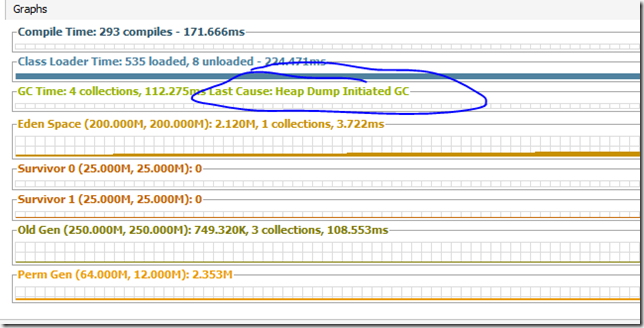
      Remember that when you click heap dump, it will trigger a GC. in the last gc secion, you can see one note called ‘heap dump initiated GC”. so you won’t be able to see the “dirty” objects.

    image

    Untitled

    image

    here, aaa is a static field of a class. so static class loader is the GC root.

    Sample Code is attached here.

    import java.io.IOException;
    import java.util.ArrayList;
    import java.util.List;

    public class GCHeap {

    •   static  List<Person []> aaa=new ArrayList<Person []>(); 
          public static void main(String[] args) throws IOException { 
                  int j=0;
              while(true)
              {
                  if(j++ % 5==0)
                  {
                      aaa=new ArrayList<Person []>();
                  }
                  Person [] arrs=new Person[20];
                  for(int i=0;i<20;i++)
                  {
                      Person p=new Person();
                      Address a=new Address();
                      a.StreetName="STREET " + i;
                      a.StreeNumber="NO" +i;
                      p.Add=a;
                      arrs[i]=p;
                  }
                  aaa.add(arrs);
                  System.out.println("j"  + j);
                  int i =System.in.read();
              }
          }

        private static class Person
        {
            public String Name;

            public Address Add;
        }

        private static class Address
        {
            public String StreetName;
            public String StreeNumber;

        }
    }

    Other Blogs about Java monitoring.

    Friday, June 4, 2010

    Android System Application Icons- Browser Application, Camera applicaiton

    app_web_browser_sm
    $app_web_browser_sm_thumb.png

    fav_icn_background
    $fav_icn_background_thumb.png
    ssl_icon
    $ssl_icon_thumb.png
    search_plate_browser.9
    $search_plate_browser.9_thumb.png
    ic_dialog_browser_security_bad
    $ic_dialog_browser_security_bad_thumb.png
    ic_dialog_browser_security_good
    $ic_dialog_browser_security_good_thumb.png
    page_indicator
    $page_indicator_thumb.png
    page_indicator_unselected2
    $page_indicator_unselected2_thumb.png
    ic_btn_bookmark_browsertab
    $ic_btn_bookmark_browsertab_thumb.png
    ic_btn_bookmarks
    $ic_btn_bookmarks_thumb.png
    ic_btn_close_panel
    $ic_btn_close_panel_thumb.png
    ic_btn_find_next
    $ic_btn_find_next_thumb.png
    ic_btn_find_prev
    $ic_btn_find_prev_thumb.png
    ic_btn_stop_v2
    $ic_btn_stop_v2_thumb.png
    ic_close_tab
    $ic_close_tab_thumb.png
    btn_close_window
    $btn_close_window_thumb.png
    ic_dialog_bookmark
    $ic_dialog_bookmark_thumb.png
    ic_dialog_browser_certificate_partially_secure
    $ic_dialog_browser_certificate_partially_secure_thumb.png
    ic_dialog_browser_certificate_secure
    $ic_dialog_browser_certificate_secure_thumb.png
    ic_dialog_menu_generic
    $ic_dialog_menu_generic_thumb.png
    ic_list_bookmark
    $ic_list_bookmark_thumb.png
    ic_list_data_large
    $ic_list_data_large_thumb.png
    ic_list_data_off
    $ic_list_data_off_thumb.png
    ic_list_data_small
    $ic_list_data_small_thumb.png
    ic_list_gps_denied
    $ic_list_gps_denied_thumb.png
    ic_list_gps_on
    $ic_list_gps_on_thumb.png
    ic_list_new_window
    $ic_list_new_window_thumb.png
    ic_search_category_browser
    $ic_search_category_browser_thumb.png
    ic_tab_bookmarks_selected
    $ic_tab_bookmarks_selected_thumb.png
    ic_tab_bookmarks_unselected
    $ic_tab_bookmarks_unselected_thumb.png
    ic_tab_history_selected
    $ic_tab_history_selected_thumb.png
    ic_tab_history_unselected
    $ic_tab_history_unselected_thumb.png
    ic_tab_most_visited_selected
    $ic_tab_most_visited_selected_thumb.png
    ic_tab_most_visited_unselected
    $ic_tab_most_visited_unselected_thumb.png
    ic_search_category_suggest
    $ic_search_category_suggest_thumb.png
    ic_search_category_bookmark
    $ic_search_category_bookmark_thumb.png
    ic_search_category_history
    $ic_search_category_history_thumb.png
    ic_launcher_browser
    $ic_launcher_browser_thumb.png
    ic_launcher_drm_file
    $ic_launcher_drm_file_thumb.png
    ic_launcher_shortcut_browser_bookmark
    $ic_launcher_shortcut_browser_bookmark_thumb.png
    ic_menu_add_bookmark
    $ic_menu_add_bookmark_thumb.png
    ic_menu_bookmark
    $ic_menu_bookmark_thumb.png
    ic_menu_bookmarks
    $ic_menu_bookmarks_thumb.png
    ic_menu_list
    $ic_menu_list_thumb.png
    ic_menu_new_window
    $ic_menu_new_window_thumb.png
    ic_menu_thumbnail
    $ic_menu_thumbnail_thumb.png
    ic_menu_windows
    $ic_menu_windows_thumb.png
    photo_inner.9
    $photo_inner.9_thumb.png
    btn_check_buttonless_off
    $btn_check_buttonless_off_thumb.png
    btn_check_buttonless_on
    $btn_check_buttonless_on_thumb.png
    ic_gallery_video_overlay
    $ic_gallery_video_overlay_thumb.png
    ic_recording_indicator
    $ic_recording_indicator_thumb.png
    ic_error_mms_video_overlay
    $ic_error_mms_video_overlay_thumb.png
    ic_camera_sym_gps
    $ic_camera_sym_gps_thumb.png
    ic_viewfinder_flash_auto
    $ic_viewfinder_flash_auto_thumb.png
    ic_viewfinder_flash_off
    $ic_viewfinder_flash_off_thumb.png
    ic_viewfinder_flash_on
    $ic_viewfinder_flash_on_thumb.png
    btn_ic_review_cancel
    $btn_ic_review_cancel_thumb.png
    btn_ic_review_delete
    $btn_ic_review_delete_thumb.png
    btn_ic_review_done
    $btn_ic_review_done_thumb.png
    btn_ic_review_play
    $btn_ic_review_play_thumb.png
    btn_ic_review_retake_photo
    $btn_ic_review_retake_photo_thumb.png
    btn_ic_review_retake_video
    $btn_ic_review_retake_video_thumb.png
    btn_ic_review_set_as
    $btn_ic_review_set_as_thumb.png
    btn_ic_review_share
    $btn_ic_review_share_thumb.png
    ic_viewfinder_empty
    $ic_viewfinder_empty_thumb.png
    ic_viewfinder_focus_infinity
    $ic_viewfinder_focus_infinity_thumb.png
    ic_viewfinder_focus_macro
    $ic_viewfinder_focus_macro_thumb.png
    ic_viewfinder_scenemode
    $ic_viewfinder_scenemode_thumb.png
    ic_viewfinder_wb_cloudy
    $ic_viewfinder_wb_cloudy_thumb.png
    ic_viewfinder_wb_daylight
    $ic_viewfinder_wb_daylight_thumb.png
    ic_viewfinder_wb_fluorescent
    $ic_viewfinder_wb_fluorescent_thumb.png
    ic_viewfinder_wb_incandescent
    $ic_viewfinder_wb_incandescent_thumb.png
    btn_ic_mode_switch_camera
    $btn_ic_mode_switch_camera_thumb.png
    btn_ic_mode_switch_video
    $btn_ic_mode_switch_video_thumb.png
    btn_mode_switch_knob_highlight
    $btn_mode_switch_knob_highlight_thumb.png
    btn_mode_switch_knob_normal
    $btn_mode_switch_knob_normal_thumb.png
    btn_mode_switch_knob_pressed
    $btn_mode_switch_knob_pressed_thumb.png
    camera_crop_height
    $camera_crop_height_thumb.png
    camera_crop_width
    $camera_crop_width_thumb.png
    detail_photo_border.9
    $detail_photo_border.9_thumb.png
    btn_mode_switch_bg.9
    $btn_mode_switch_bg.9_thumb.png
    indicator_autocrop
    $indicator_autocrop_thumb.png
    image_border_bg_focus_blue.9
    $image_border_bg_focus_blue.9_thumb.png
    image_border_bg_normal.9
    $image_border_bg_normal.9_thumb.png
    image_border_bg_pressed_blue.9
    $image_border_bg_pressed_blue.9_thumb.png
    ic_btn_actionmenu_attach_default
    $ic_btn_actionmenu_attach_default_thumb.png
    ic_btn_actionmenu_attach_pressed
    $ic_btn_actionmenu_attach_pressed_thumb.png
    ic_btn_actionmenu_attach_selected
    $ic_btn_actionmenu_attach_selected_thumb.png
    ic_btn_actionmenu_cancel_default
    $ic_btn_actionmenu_cancel_default_thumb.png
    ic_btn_actionmenu_cancel_pressed
    $ic_btn_actionmenu_cancel_pressed_thumb.png
    ic_btn_actionmenu_cancel_selected
    $ic_btn_actionmenu_cancel_selected_thumb.png
    ic_btn_actionmenu_delete_default
    $ic_btn_actionmenu_delete_default_thumb.png
    ic_btn_actionmenu_delete_pressed
    $ic_btn_actionmenu_delete_pressed_thumb.png
    ic_btn_actionmenu_delete_selected
    $ic_btn_actionmenu_delete_selected_thumb.png
    ic_btn_actionmenu_gallery_default
    $ic_btn_actionmenu_gallery_default_thumb.png
    ic_btn_actionmenu_gallery_pressed
    $ic_btn_actionmenu_gallery_pressed_thumb.png
    ic_btn_actionmenu_gallery_selected
    $ic_btn_actionmenu_gallery_selected_thumb.png
    ic_btn_actionmenu_play_default
    $ic_btn_actionmenu_play_default_thumb.png
    ic_btn_actionmenu_play_pressed
    $ic_btn_actionmenu_play_pressed_thumb.png
    ic_btn_actionmenu_play_selected
    $ic_btn_actionmenu_play_selected_thumb.png
    ic_btn_actionmenu_set_as_default
    $ic_btn_actionmenu_set_as_default_thumb.png
    ic_btn_actionmenu_set_as_pressed
    $ic_btn_actionmenu_set_as_pressed_thumb.png
    ic_btn_actionmenu_set_as_selected
    $ic_btn_actionmenu_set_as_selected_thumb.png
    ic_btn_actionmenu_share_default
    $ic_btn_actionmenu_share_default_thumb.png
    ic_btn_actionmenu_share_pressed
    $ic_btn_actionmenu_share_pressed_thumb.png
    ic_btn_actionmenu_share_selected
    $ic_btn_actionmenu_share_selected_thumb.png
    ic_launcher_camera
    $ic_launcher_camera_thumb.png
    ic_launcher_gallery
    $ic_launcher_gallery_thumb.png
    ic_launcher_video_camera
    $ic_launcher_video_camera_thumb.png
    ic_menu_3d_globe
    $ic_menu_3d_globe_thumb.png
    ic_menu_camera_video_view
    $ic_menu_camera_video_view_thumb.png
    ic_menu_multiselect_gallery
    $ic_menu_multiselect_gallery_thumb.png
    ic_menu_view_details
    $ic_menu_view_details_thumb.png
    ic_missing_thumbnail_picture
    $ic_missing_thumbnail_picture_thumb.png
    ic_missing_thumbnail_video
    $ic_missing_thumbnail_video_thumb.png
    frame_overlay_gallery_camera
    $frame_overlay_gallery_camera_thumb.png
    frame_overlay_gallery_folder
    $frame_overlay_gallery_folder_thumb.png
    frame_overlay_gallery_video
    $frame_overlay_gallery_video_thumb.png
    border_last_picture_highlight.9
    $border_last_picture_highlight.9_thumb.png
    border_last_picture_normal.9
    $border_last_picture_normal.9_thumb.png
    border_last_picture_pressed.9
    $border_last_picture_pressed.9_thumb.png
    border_view_finder.9
    $border_view_finder.9_thumb.png
    btn_camera_arrow_left_default
    $btn_camera_arrow_left_default_thumb.png
    btn_camera_arrow_left_press
    $btn_camera_arrow_left_press_thumb.png
    btn_camera_arrow_left_selected
    $btn_camera_arrow_left_selected_thumb.png
    btn_camera_arrow_right_default
    $btn_camera_arrow_right_default_thumb.png
    btn_camera_arrow_right_press
    $btn_camera_arrow_right_press_thumb.png
    btn_camera_arrow_right_selected
    $btn_camera_arrow_right_selected_thumb.png
    btn_camera_review_highlight.9
    $btn_camera_review_highlight.9_thumb.png
    btn_camera_review_normal.9
    $btn_camera_review_normal.9_thumb.png
    btn_camera_review_pressed.9
    $btn_camera_review_pressed.9_thumb.png
    on_screen_hint_frame.9
    $on_screen_hint_frame.9_thumb.png
    btn_ic_video_record
    $btn_ic_video_record_thumb.png
    btn_ic_video_record_stop
    $btn_ic_video_record_stop_thumb.png
    btn_shutter_normal
    $btn_shutter_normal_thumb.png
    btn_shutter_pressed
    $btn_shutter_pressed_thumb.png
     
    Locations of visitors to this page